Zurück

Doppel-Triggerung: Diagnose, Unterscheidung und Behebung

Artikel

Autor: David Grooms

Datum: 08.07.2019

Eine mangelnde Abstimmung in der Schnittstelle zwischen Patient und Beatmungsgerät ist ein Phänomen, das häufig bei invasiv und nichtinvasiv maschinell beatmeten Patienten auftritt. Der Begriff „Dyssynchronie“ legt eine Abnormalität in der erwarteten Synchronie zwischen Patient und Beatmungsgerät nahe.
Doppel-Triggerung: Diagnose, Unterscheidung und Behebung

Kernaussagen

  • Eine mangelnde Abstimmung zwischen Patient und Beatmungsgerät, auch bekannt als Dyssonchronie, kommt oft bei maschinell beatmeten Patienten vor.
  • Eine der häufigsten Formen ist die Doppel-Triggerung, die für gewöhnlich durch eine unzureichende Abstimmung der Inspirationszeiten bei maschinellen Atemhüben mit neuralen Inspirationszeiten hervorgerufen wird. Dies ist insbesondere bei ARDS-Patienten problematisch, da dies zu einer übermässigen Verabreichung von Tidalvolumen führen kann.
  • Die Diagnose von Doppel-Triggerung und die Unterscheidung der drei verschiedenen Typen kann eine beachtliche Herausforderung darstellen. Dazu müssen die skalaren Kurven des Beatmungsgerätes genau beobachtet und analysiert werden.
  • Neue Technologien können das medizinische Fachpersonal bei der Vermeidung einer Doppel-Triggerung unterstützen, indem sie die Inspirationszeit automatisch an die Bedürfnisse des Patienten anpassen.

Was ist Doppel-Triggerung?

Die Häufigkeit von Dyssynchronien wurde untersucht; gemäss Schätzungen tritt bei nicht weniger als 50 % der Patienten, die für mindestens 24 Stunden maschinell beatmet werden, mindestens einmal eine Dyssonchronie auf. Die zwei häufigsten Typen von Dyssynchronie sind ineffektive (erfolglose) Triggerung und Doppel-Triggerung (DT) (Thille AW, Rodriguez P, Cabello B, Lellouche F, Brochard L. Patient-ventilator asynchrony during assisted mechanical ventilation. Intensive Care Med. 2006;32(10):1515-1522. doi:10.1007/s00134-006-0301-81​). Doppel-Triggerung ist definiert als die Verabreichung von zwei Inspirationen durch das Beatmungsgerät während einer einzigen inspiratorischen Bemühung des Patienten (Liao KM, Ou CY, Chen CW. Classifying different types of double triggering based on airway pressure and flow deflection in mechanically ventilated patients. Respir Care. 2011;56(4):460-466. doi:10.4187/respcare.007312​). Die Ursache dieser Dyssynchronie liegt in der deutlich kürzeren Inspirationszeit (I-Zeit) des maschinellen Atemhubs im Vergleich zur neuralen Inspirationszeit des Patienten. Die daraus resultierende vorzeitige Einleitung der ersten Exspiration kann die unbeabsichtigte Verabreichung eines zweiten Atemhubs während derselben inspiratorischen Bemühung des Patienten hervorrufen. Dies ist vor allem bei Patienten mit akutem Atemnotsyndrom problematisch und tritt am häufigsten bei der volumenorientierten Beatmung mit fest eingestelltem Flow auf, da dieser in Folge von Breath Stacking zu einer übermässigen Verabreichung von Tidalvolumen führen kann (Pohlman MC, McCallister KE, Schweickert WD, et al. Excessive tidal volume from breath stacking during lung-protective ventilation for acute lung injury. Crit Care Med. 2008;36(11):3019-3023. doi:10.1097/CCM.0b013e31818b308b3​). Auch wenn dieses Konzept einfach verständlich erscheint, so wird dieses Problem dennoch vom Anwender oft übersehen und nicht erkannt (Colombo D, Cammarota G, Alemani M, et al. Efficacy of ventilator waveforms observation in detecting patient-ventilator asynchrony. Crit Care Med. 2011;39(11):2452-2457. doi:10.1097/CCM.0b013e318225753c4​).

Diagnose und Behebung

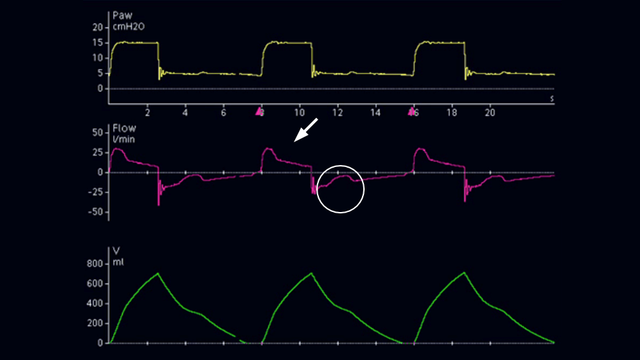
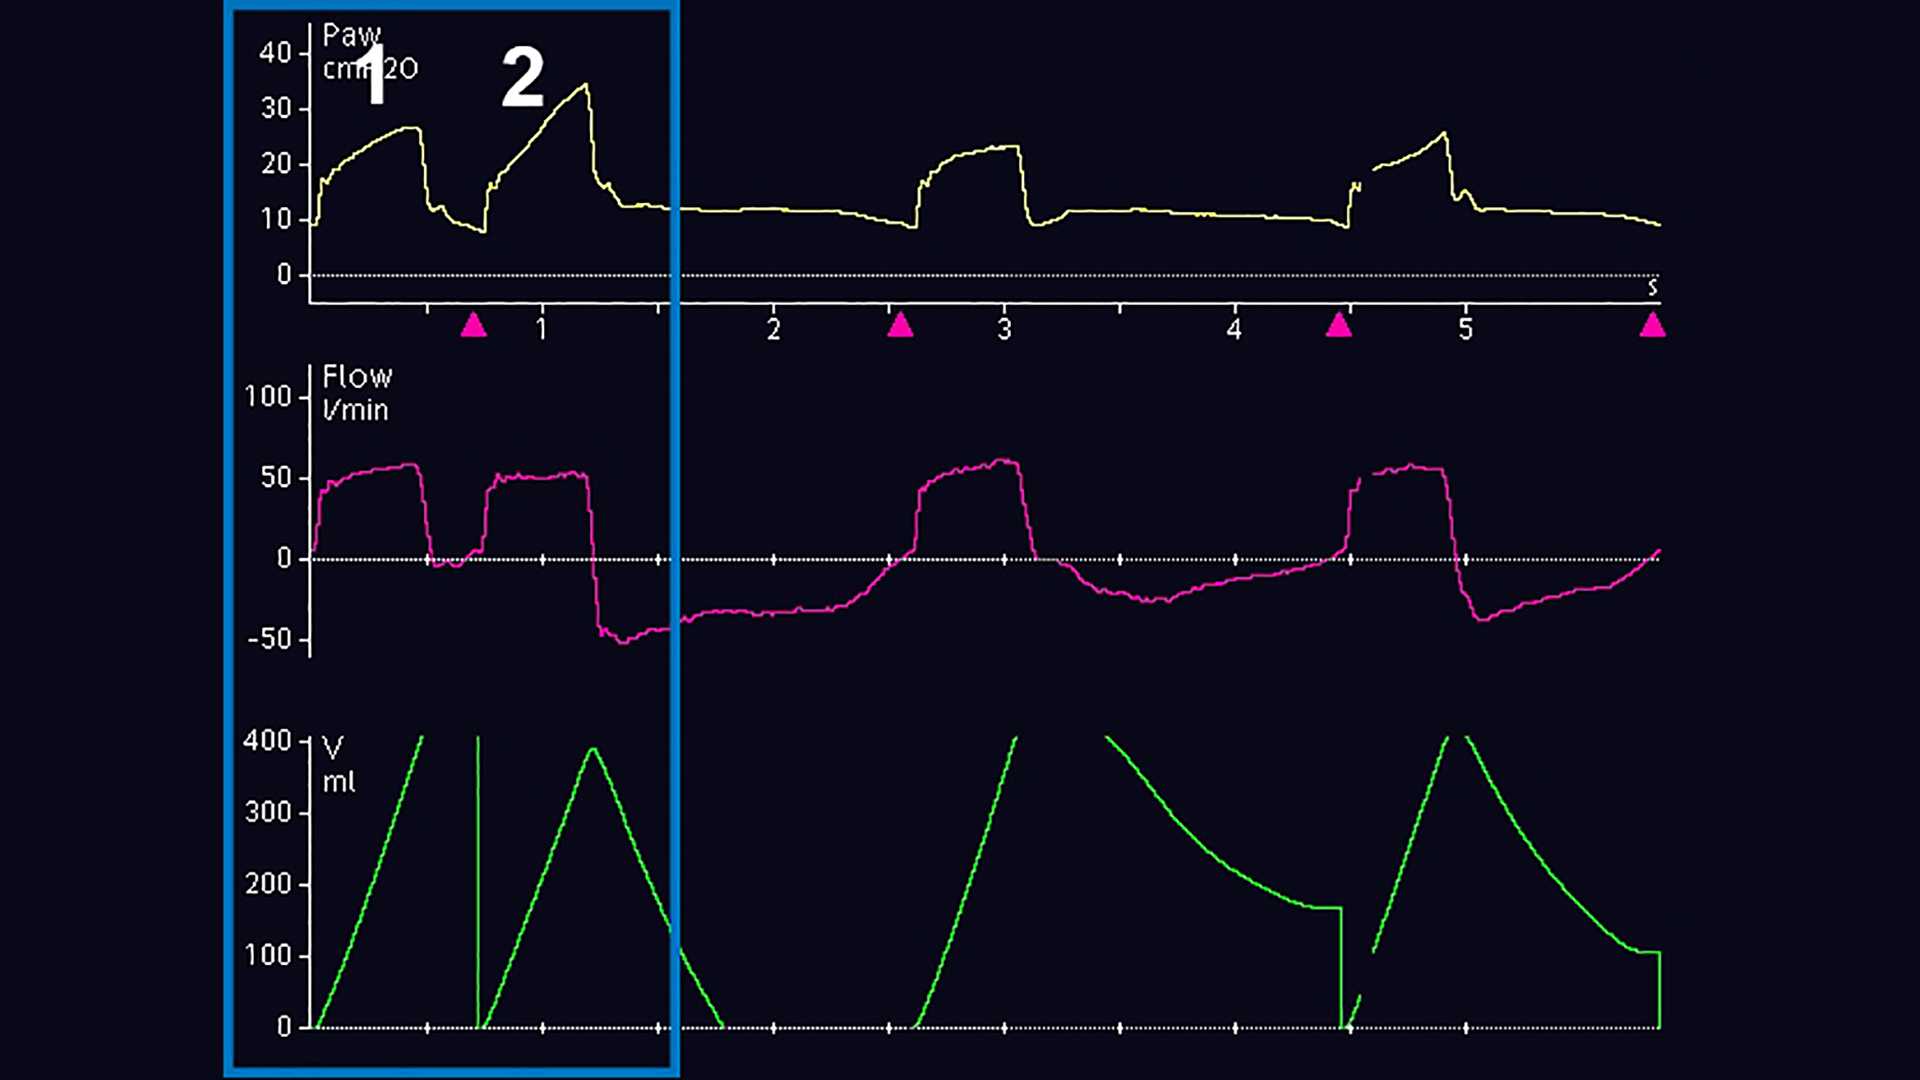
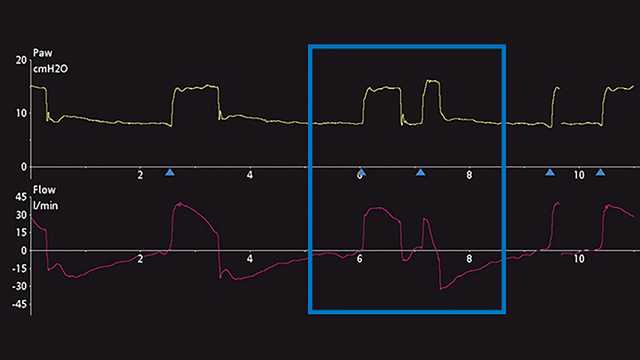
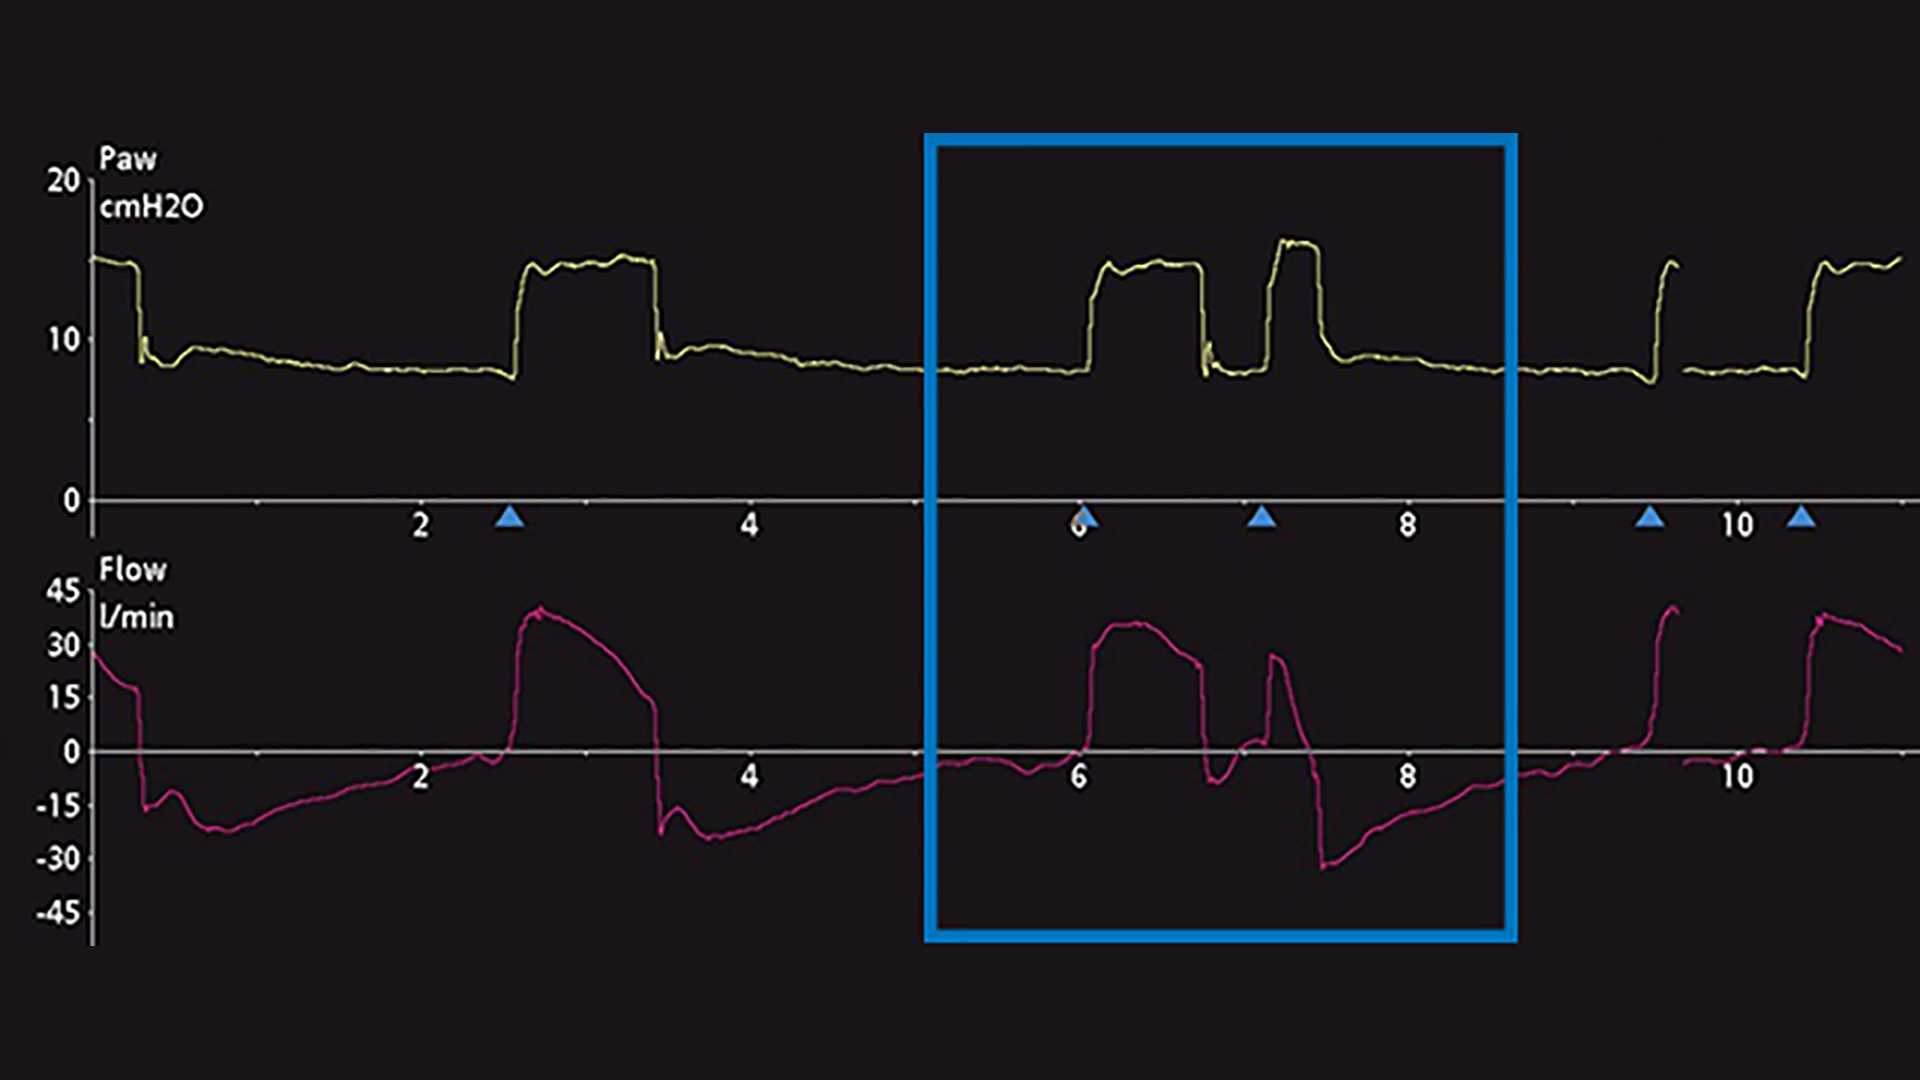
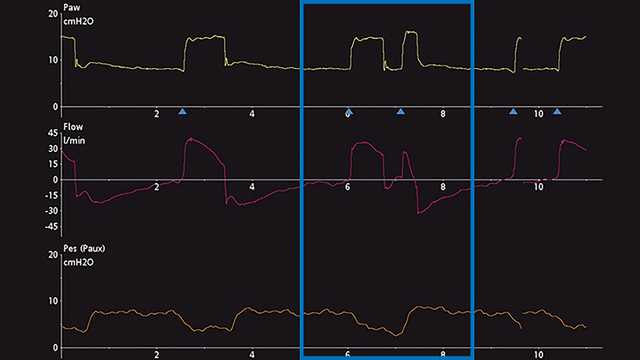
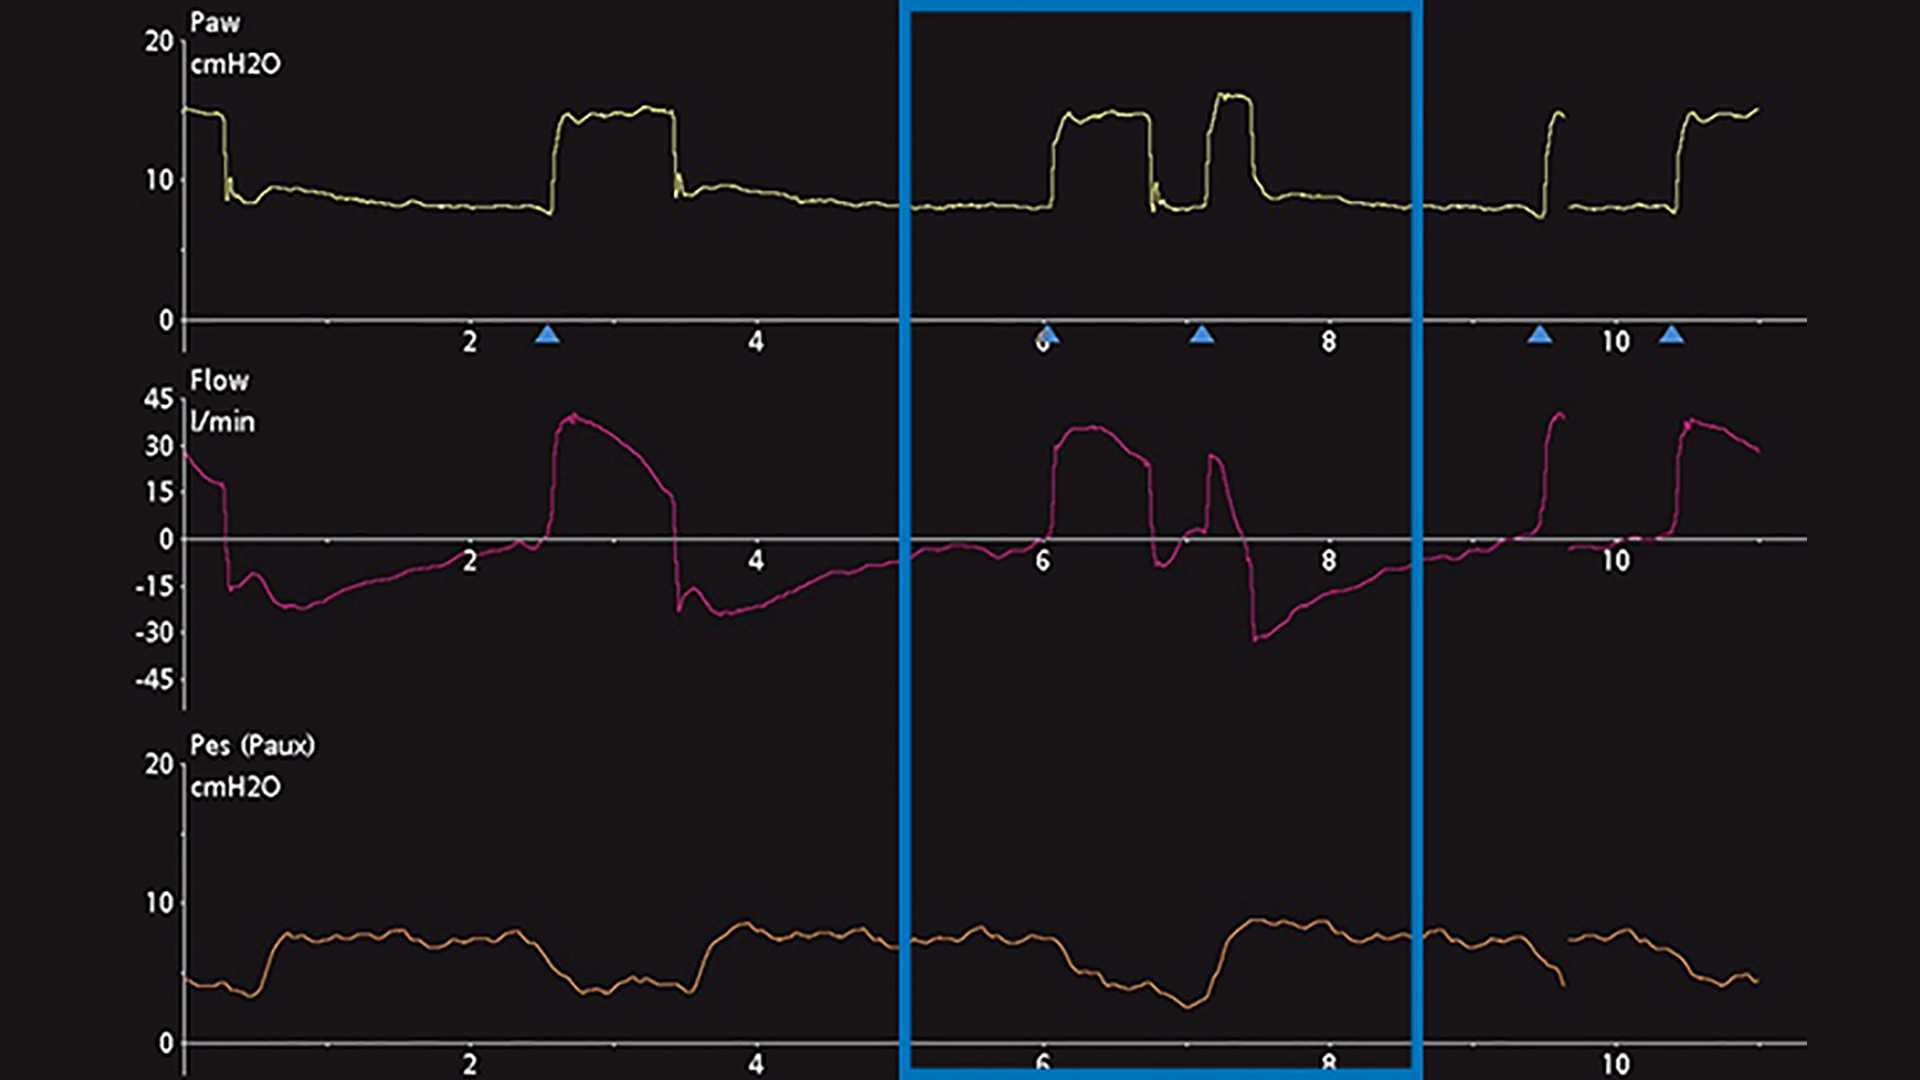
Die wichtigste Methode zur Erkennung von DT ist die Beobachtung und Auswertung der skalaren Kurven des Beatmungsgerätes. Unter einer skalaren Kurve versteht man die Darstellung einer jeglichen Variable im zeitlichen Verlauf. Die meisten Beatmungsgeräte bieten für gewöhnlich die Darstellung von Druck, Flow und/oder Volumen im zeitlichen Verlauf. Für eine einfachere Analyse dieser Kurven ermöglichen manche Beatmungsgeräte zusätzlich die Darstellung des ösophagealen Drucks (Näherungswert für Pleuradruck) im zeitlichen Verlauf. Die Schritte für eine angemessene Erkennung von DT sind in Screenshots von Kurven am Beatmungsgerät unten angeführt. Abbildung 1 zeigt häufige Druck, Flow- und Volumenkurven, die das DT-Phänomen bei invasiver Beatmung darlegen. Für ein ungeschultes Auge ist es anfangs u. U. schwierig, dieses Phänomen zu erkennen und die Ursache dieses Problems korrekt zu bestimmen. Häufig wird fälschlicherweise angenommen, dass der Patient nach Verabreichung des maschinell ausgelösten Atemhubs (Atemhub 1) aktiv einen zweiten Atemhub getriggert hat (Atemhub 2) oder dass der Patient „lufthungrig“ ist. Wenn das Problem nicht behoben wird, kann es zu schwerwiegenden unerwünschten Wirkungen bei der maschinellen Beatmung kommen.  Deswegen wird eine genauere Analyse empfohlen. Dazu kann eine Messung des ösophagealen Drucks vorgenommen werden, um den Pleuradruck mit dem Atemwegsdruck und den Flow-Veränderungen des Beatmungsgerätes zu vergleichen und zu beurteilen. In einem weiteren Beispiel unten werden auf einem Beatmungsgerät die Skalare für Druck und Flow im Verlauf der Zeit angezeigt. Dies bietet einen subtilen Hinweis auf eine mögliche DT, kann aber auch als zusätzliche aktive inspiratorischen Bemühung des Patienten missgedeutet werden (Abbildung 2). Nach dem Hinzufügen der skalaren Kurve für den ösophagealen Druck (Pes (Paux)-Kurve) wird klar, dass es sich in der Tat um Doppel-Triggerung handelt, da während einer einzigen aktiven inspiratorischen Bemühung ein weiterer Atemhub verabreicht wird (siehe Abnahme im Pleuradruck in Abbildung 3).

Druck-, Flow- und Volumenkurve, aus denen eine Doppel-Triggerung hervorgeht
Abbildung 1
Druck-, Flow- und Volumenkurve, aus denen eine Doppel-Triggerung hervorgeht
Abbildung 1
Druck- und Flow-Kurven, aus denen eine Doppel-Triggerung hervorgeht
Abbildung 2
Druck- und Flow-Kurven, aus denen eine Doppel-Triggerung hervorgeht
Abbildung 2
Kurve für den ösophagealen Druck, die einen Abfall im Pleuradruck anzeigt
Abbildung 3
Kurve für den ösophagealen Druck, die einen Abfall im Pleuradruck anzeigt
Abbildung 3

Unterscheidung

Den Typ der DT zu erkennen und einzuteilen, kann am Patientenbett auch eine Herausforderung darstellen. Gemäss aktuellen Studien kann die DT in drei verschiedene Typen unterteilt werden (Liao KM, Ou CY, Chen CW. Classifying different types of double triggering based on airway pressure and flow deflection in mechanically ventilated patients. Respir Care. 2011;56(4):460-466. doi:10.4187/respcare.007312​):

  • Vom Patienten ausgelöst (DT-P): Der erste ausgelöste Atemhub weist einen Anstieg im ösophagealen Druck von > 1 cmH2O auf und kann mit einer starken inspiratorischen Bemühung im Zusammenhang stehen
  • Automatisch ausgelöst (DT-A): Der erste ausgelöste Atemhub erfolgt vor dem vom Beatmungsgerät festgelegten Zeitpunkt der Triggerung, ohne dass gleichzeitig der ösophageale Druck abfällt
  • Vom Beatmungsgerät ausgelöst (DT-B): Der erste ausgelöste Atemhub erfolgt zu der vom Beatmungsgerät festgelegten Zeit, ohne dass gleichzeitig der ösophageale Druck abfällt

Daten belegen, dass es in der prä-inspiratorischen Phase oft zu einer Verzögerung der Triggerung von 0,07 bis 0,13 Sekunden kommt (Takeuchi M, Williams P, Hess D, Kacmarek RM. Continuous positive airway pressure in new-generation mechanical ventilators: a lung model study. Anesthesiology. 2002;96(1):162-172. doi:10.1097/00000542-200201000-000305​). Die Auswertung der Abnahme des Atemwegdrucks ist aussagekräftiger als die Veränderung des Flows in der Triggerverzögerungsphase von 0,13 Sekunden (Liao KM, Ou CY, Chen CW. Classifying different types of double triggering based on airway pressure and flow deflection in mechanically ventilated patients. Respir Care. 2011;56(4):460-466. doi:10.4187/respcare.007312​). Somit können anhand der Druckabnahme von > 0,49 cmH2O DT-P-Atemhübe von DT-A und DT-B unterschieden werden (Liao KM, Ou CY, Chen CW. Classifying different types of double triggering based on airway pressure and flow deflection in mechanically ventilated patients. Respir Care. 2011;56(4):460-466. doi:10.4187/respcare.007312​). Zusätzliche Daten unterstreichen, dass die neurale Inspirationszeit, die dem Zeitraum vom Beginn des starken Abfallens des ösophagealen Drucks bis zu seinem Tiefpunkt entspricht, beim ersten DT-P-Atemhub signifikant länger war als bei vorangehenden Atemhüben (Parthasarathy S, Jubran A, Tobin MJ. Assessment of neural inspiratory time in ventilator-supported patients. Am J Respir Crit Care Med. 2000;162(2 Pt 1):546-552. doi:10.1164/ajrccm.162.2.99010246​). Somit können das Abfallen des Atemwegdrucks, kombiniert mit Berechnungen der neuralen Inspirationszeit, herangezogen werden, um eine Doppel-Triggerung beim Patienten zu identifizieren.

Auflösung: IntelliSync+

Die häufigsten Ursachen für DT sind eine mangelnde Abstimmung der Inspirationszeiten bei maschinellen Atemhüben mit neuralen Inspirationszeiten sowie eine unzureichende Druckunterstützung mit hohen Atemantrieben (Kallet RH, Campbell AR, Dicker RA, Katz JA, Mackersie RC. Effects of tidal volume on work of breathing during lung-protective ventilation in patients with acute lung injury and acute respiratory distress syndrome. Crit Care Med. 2006;34(1):8-14. doi:10.1097/01.ccm.0000194538.32158.af7​). Genauer gesagt ist die Inspirationszeit bei maschinellen Atemhüben im Vergleich zur längeren neuralen Inspirationszeit zu kurz. DT kann minimiert oder gar beseitigt werden, indem die Inspirationszeit bei maschinellen Atemhüben verlängert wird, um sie an die neurale Inspirationszeit des Patienten anzugleichen; alternativ können der Ausgangsdruck und das Tidalvolumen des Beatmungsgerätes erhöht werden (Vignaux L, Vargas F, Roeseler J, et al. Patient-ventilator asynchrony during non-invasive ventilation for acute respiratory failure: a multicenter study. Intensive Care Med. 2009;35(5):840-846. doi:10.1007/s00134-009-1416-58​). Dies erfordert jedoch,  dass ein Endanwender anwesend ist und ihm das Phänomen auffällt, sowie eine manuelle Veränderung der Einstellungen am Beatmungsgerät. Eine Automatisierung dieser Anpassung wird mit der Funktion IntelliSync+ (Nicht für alle Märkte verfügbar.A) bei Beatmungsgeräten von Hamilton Medical ermöglicht. IntelliSync+ beobachtet die Cycling-Kriterien bei jedem Atemhub genau und passt die Inspirationszeit an die Bedürfnisse des Patienten an. Diese Option verringert die Anzahl der Asynchronien und erhöht somit den Patientenkomfort. Sie kann sich sogar positiv auf das Behandlungsergebnis des Patienten auswirken.

Fußnoten

  • A. Nicht für alle Märkte verfügbar.

Referenzen

  1. 1. Thille AW, Rodriguez P, Cabello B, Lellouche F, Brochard L. Patient-ventilator asynchrony during assisted mechanical ventilation. Intensive Care Med. 2006;32(10):1515-1522. doi:10.1007/s00134-006-0301-8
  2. 2. Liao KM, Ou CY, Chen CW. Classifying different types of double triggering based on airway pressure and flow deflection in mechanically ventilated patients. Respir Care. 2011;56(4):460-466. doi:10.4187/respcare.00731
  3. 3. Pohlman MC, McCallister KE, Schweickert WD, et al. Excessive tidal volume from breath stacking during lung-protective ventilation for acute lung injury. Crit Care Med. 2008;36(11):3019-3023. doi:10.1097/CCM.0b013e31818b308b
  4. 4. Colombo D, Cammarota G, Alemani M, et al. Efficacy of ventilator waveforms observation in detecting patient-ventilator asynchrony. Crit Care Med. 2011;39(11):2452-2457. doi:10.1097/CCM.0b013e318225753c
  5. 5. Takeuchi M, Williams P, Hess D, Kacmarek RM. Continuous positive airway pressure in new-generation mechanical ventilators: a lung model study. Anesthesiology. 2002;96(1):162-172. doi:10.1097/00000542-200201000-00030
  6. 6. Parthasarathy S, Jubran A, Tobin MJ. Assessment of neural inspiratory time in ventilator-supported patients. Am J Respir Crit Care Med. 2000;162(2 Pt 1):546-552. doi:10.1164/ajrccm.162.2.9901024
  7. 7. Kallet RH, Campbell AR, Dicker RA, Katz JA, Mackersie RC. Effects of tidal volume on work of breathing during lung-protective ventilation in patients with acute lung injury and acute respiratory distress syndrome. Crit Care Med. 2006;34(1):8-14. doi:10.1097/01.ccm.0000194538.32158.af
  8. 8. Vignaux L, Vargas F, Roeseler J, et al. Patient-ventilator asynchrony during non-invasive ventilation for acute respiratory failure: a multicenter study. Intensive Care Med. 2009;35(5):840-846. doi:10.1007/s00134-009-1416-5

Patient-ventilator asynchrony during assisted mechanical ventilation.

Thille AW, Rodriguez P, Cabello B, Lellouche F, Brochard L. Patient-ventilator asynchrony during assisted mechanical ventilation. Intensive Care Med. 2006;32(10):1515-1522. doi:10.1007/s00134-006-0301-8


OBJECTIVE

The incidence, pathophysiology, and consequences of patient-ventilator asynchrony are poorly known. We assessed the incidence of patient-ventilator asynchrony during assisted mechanical ventilation and we identified associated factors.

METHODS

Sixty-two consecutive patients requiring mechanical ventilation for more than 24 h were included prospectively as soon as they triggered all ventilator breaths: assist-control ventilation (ACV) in 11 and pressure-support ventilation (PSV) in 51.

MEASUREMENTS

Gross asynchrony detected visually on 30-min recordings of flow and airway pressure was quantified using an asynchrony index.

RESULTS

Fifteen patients (24%) had an asynchrony index greater than 10% of respiratory efforts. Ineffective triggering and double-triggering were the two main asynchrony patterns. Asynchrony existed during both ACV and PSV, with a median number of episodes per patient of 72 (range 13-215) vs. 16 (4-47) in 30 min, respectively (p=0.04). Double-triggering was more common during ACV than during PSV, but no difference was found for ineffective triggering. Ineffective triggering was associated with a less sensitive inspiratory trigger, higher level of pressure support (15 cmH(2)O, IQR 12-16, vs. 17.5, IQR 16-20), higher tidal volume, and higher pH. A high incidence of asynchrony was also associated with a longer duration of mechanical ventilation (7.5 days, IQR 3-20, vs. 25.5, IQR 9.5-42.5).

CONCLUSIONS

One-fourth of patients exhibit a high incidence of asynchrony during assisted ventilation. Such a high incidence is associated with a prolonged duration of mechanical ventilation. Patients with frequent ineffective triggering may receive excessive levels of ventilatory support.

Classifying different types of double triggering based on airway pressure and flow deflection in mechanically ventilated patients.

Liao KM, Ou CY, Chen CW. Classifying different types of double triggering based on airway pressure and flow deflection in mechanically ventilated patients. Respir Care. 2011;56(4):460-466. doi:10.4187/respcare.00731


BACKGROUND

Double-triggering (DT) is a frequent type of patient-ventilator asynchrony and has potentially severe consequences, such as alveolar overdistention or the generation of intrinsic PEEP. However, the first breath of DT could be patient-triggered (DT-P), auto-triggered (DT-A), or ventilator-triggered (DT-V).

OBJECTIVE

To differentiate DT-P, DT-A, and DT-V using airway pressure or flow changes during the trigger-delay phase in ventilated patients.

METHODS

Fourteen mechanically ventilated patients with DT were included. All patients were on flow-triggered ventilation modes and received either continuous mandatory ventilation or pressure support ventilation. Breaths in which the first breath was associated with an esophageal pressure drop of > 1 cm H(2)O were categorized as DT-P. Breaths in which the first breath occurred at the ventilator set cycle were categorized as DT-V. Breaths in which the first breath occurred earlier than the ventilator set cycle without esophageal pressure drop were categorized as DT-A. The pressure drop and flow change at 0.13 s (PD(0.13) and F(0.13), respectively) in the trigger-delay phase were calculated from the nadir.

RESULTS

There were 507 double-triggered breaths: 271 DT-V (53%), 50 DT-A (10%), and 186 DT-P (37%). The PD(0.13) for DT-V, DT-A, and DT-P were 0.16 ± 0.12 cm H(2)O, 0.25 ± 0.17 cm H(2)O, and 1.34 ± 0.67 cm H(2)O, respectively. The F(0.13) for DT-V, DT-A, and DT-P were 2.11 ± 2.31 L/min, 2.64 ± 2.07 L/min, and 16.51 ± 8.02 L/min, respectively. The best discriminatory criteria for differentiating DT-P from DT-V and DT-A, based on the Youden index (sensitivity + specificity - 1) was PD(0.13) ≥ 0.49 cm H(2)O, which had a Youden index of 95%.

CONCLUSION

DT-P can be distinguished from DT-V and DT-A by using airway pressure deflections in the trigger-delay phase.

Excessive tidal volume from breath stacking during lung-protective ventilation for acute lung injury.

Pohlman MC, McCallister KE, Schweickert WD, et al. Excessive tidal volume from breath stacking during lung-protective ventilation for acute lung injury. Crit Care Med. 2008;36(11):3019-3023. doi:10.1097/CCM.0b013e31818b308b


RATIONALE

Low tidal volume ventilation strategies for patients with respiratory failure from acute lung injury may lead to breath stacking and higher volumes than intended.

OBJECTIVE

To determine frequency, risk factors, and volume of stacked breaths during low tidal volume ventilation for acute lung injury.

DESIGN, SETTING, AND PATIENTS

Prospective cohort study of mechanically ventilated patients with acute lung injury (enrolled from August 2006 through May 2007) treated with low tidal volume ventilation in a medical intensive care unit at an academic tertiary care hospital.

INTERVENTIONS

Patients were ventilated with low tidal volumes using the Acute Respiratory Distress Syndrome Network protocol for acute lung injury. Continuous flow-time and pressure-time waveforms were recorded. The frequency, risk factors, and volume of stacked breaths were determined. Sedation depth was monitored using Richmond agitation sedation scale.

MEASUREMENTS AND MAIN RESULTS

Twenty patients were enrolled and studied for a mean 3.3 +/- 1.7 days. The median (interquartile range) Richmond agitation sedation scale was -4 (-5, -3). Inter-rater agreement for identifying stacked breaths was high (kappa 0.99, 95% confidence interval 0.98-0.99). Stacked breaths occurred at a mean 2.3 +/- 3.5 per minute and resulted in median volumes of 10.1 (8.8-10.7) mL/kg predicted body weight, which was 1.62 (1.44-1.82) times the set tidal volume. Stacked breaths were significantly less common with higher set tidal volumes (relative risk 0.4 for 1 mL/kg predicted body weight increase in tidal volume, 95% confidence interval 0.23-0.90).

CONCLUSION

Stacked breaths occur frequently in low tidal volume ventilation despite deep sedation and result in volumes substantially above the set tidal volume. Set tidal volume has a strong influence on frequency of stacked breaths.

Efficacy of ventilator waveforms observation in detecting patient-ventilator asynchrony.

Colombo D, Cammarota G, Alemani M, et al. Efficacy of ventilator waveforms observation in detecting patient-ventilator asynchrony. Crit Care Med. 2011;39(11):2452-2457. doi:10.1097/CCM.0b013e318225753c


OBJECTIVES

The value of visual inspection of ventilator waveforms in detecting patient-ventilator asynchronies in the intensive care unit has never been systematically evaluated. This study aims to assess intensive care unit physicians' ability to identify patient-ventilator asynchronies through ventilator waveforms.

DESIGN

Prospective observational study.

SETTING

Intensive care unit of a University Hospital.

PATIENTS

Twenty-four patients receiving mechanical ventilation for acute respiratory failure.

INTERVENTION

Forty-three 5-min reports displaying flow-time and airway pressure-time tracings were evaluated by 10 expert and 10 nonexpert, i.e., residents, intensive care unit physicians. The asynchronies identified by experts and nonexperts were compared with those ascertained by three independent examiners who evaluated the same reports displaying, additionally, tracings of diaphragm electrical activity.

MEASUREMENTS AND MAIN RESULTS

Data were examined according to both breath-by-breath analysis and overall report analysis. Sensitivity, specificity, and positive and negative predictive values were determined. Sensitivity and positive predictive value were very low with breath-by-breath analysis (22% and 32%, respectively) and fairly increased with report analysis (55% and 44%, respectively). Conversely, specificity and negative predictive value were high with breath-by-breath analysis (91% and 86%, respectively) and slightly lower with report analysis (76% and 82%, respectively). Sensitivity was significantly higher for experts than for nonexperts for breath-by-breath analysis (28% vs. 16%, p < .05), but not for report analysis (63% vs. 46%, p = .15). The prevalence of asynchronies increased at higher ventilator assistance and tidal volumes (p < .001 for both), whereas it decreased at higher respiratory rates and diaphragm electrical activity (p < .001 for both). At higher prevalence, sensitivity decreased significantly (p < .001).

CONCLUSIONS

The ability of intensive care unit physicians to recognize patient-ventilator asynchronies was overall quite low and decreased at higher prevalence; expertise significantly increased sensitivity for breath-by-breath analysis, whereas it only produced a trend toward improvement for report analysis.

Continuous positive airway pressure in new-generation mechanical ventilators: a lung model study.

Takeuchi M, Williams P, Hess D, Kacmarek RM. Continuous positive airway pressure in new-generation mechanical ventilators: a lung model study. Anesthesiology. 2002;96(1):162-172. doi:10.1097/00000542-200201000-00030


BACKGROUND

A number of new microprocessor-controlled mechanical ventilators have become available over the last few years. However, the ability of these ventilators to provide continuous positive airway pressure without imposing or performing work has never been evaluated.

METHODS

In a spontaneously breathing lung model, the authors evaluated the Bear 1000, Drager Evita 4, Hamilton Galileo, Nellcor-Puritan-Bennett 740 and 840, Siemens Servo 300A, and Bird Products Tbird AVS at 10 cm H(2)O continuous positive airway pressure. Lung model compliance was 50 ml/cm H(2)O with a resistance of 8.2 cm H(2)O x l(-1) x s(-1), and inspiratory time was set at 1.0 s with peak inspiratory flows of 40, 60, and 80 l/min. In ventilators with both pressure and flow triggering, the response of each was evaluated.

RESULTS

With all ventilators, peak inspiratory flow, lung model tidal volume, and range of pressure change (below baseline to above baseline) increased as peak flow increased. Inspiratory trigger delay time, inspiratory cycle delay time, expiratory pressure time product, and total area of pressure change were not affected by peak flow, whereas pressure change to trigger inspiration, inspiratory pressure time product, and trigger pressure time product were affected by peak flow on some ventilators. There were significant differences among ventilators on all variables evaluated, but there was little difference between pressure and flow triggering in most variables on individual ventilators except for pressure to trigger. Pressure to trigger was 3.74 +/- 1.89 cm H(2)O (mean +/- SD) in flow triggering and 4.48 +/- 1.67 cm H(2)O in pressure triggering (P < 0.01) across all ventilators.

CONCLUSIONS

Most ventilators evaluated only imposed a small effort to trigger, but most also provided low-level pressure support and imposed an expiratory workload. Pressure triggering during continuous positive airway pressure does require a slightly greater pressure than flow triggering.

Assessment of neural inspiratory time in ventilator-supported patients.

Parthasarathy S, Jubran A, Tobin MJ. Assessment of neural inspiratory time in ventilator-supported patients. Am J Respir Crit Care Med. 2000;162(2 Pt 1):546-552. doi:10.1164/ajrccm.162.2.9901024

Neural inspiratory time (TI) is a measurement of fundamental importance in studies of patient-ventilator interaction. The measurement is usually based on recordings of flow, esophageal pressure (Pes), and transdiaphragmatic pressure (Pdi), but the concordance of such estimates of neural TI with a more direct measurement of neural activity has not been systematically evaluated. To address this issue, we studied nine ventilator-supported patients in whom we employed esophageal electrode recordings of the diaphragmatic electromyogram (EMG) as the reference measurement of neural TI. Comparison of the indirect estimates of neural TI duration, based on flow, Pes, and Pdi against the reference measurement, revealed a mean difference (bias) ranging from -54 to 612 ms during spontaneous breathing and from -52 to 714 ms during mechanical ventilation; the respective precisions (standard deviations of the differences) ranged from 79 to 175 ms and from 74 to 221 ms. Because an indirect estimate of neural TI duration could be identical to that of the reference measurement and yet be displaced in time, this lag or lead was quantified as the phase angle of neural TI onset. Flow-based estimates of the onset of neural TI displayed a systematic lag, which may be explained at least in part by concurrent intrinsic positive end-expiratory pressure. In conclusion, the indirect estimates of the onset and duration of neural TI in ventilator-dependent patients displayed poor agreement with the diaphragmatic EMG measurement of neural TI.

Effects of tidal volume on work of breathing during lung-protective ventilation in patients with acute lung injury and acute respiratory distress syndrome.

Kallet RH, Campbell AR, Dicker RA, Katz JA, Mackersie RC. Effects of tidal volume on work of breathing during lung-protective ventilation in patients with acute lung injury and acute respiratory distress syndrome. Crit Care Med. 2006;34(1):8-14. doi:10.1097/01.ccm.0000194538.32158.af


OBJECTIVE

To assess the effects of step-changes in tidal volume on work of breathing during lung-protective ventilation in patients with acute lung injury (ALI) or the acute respiratory distress syndrome (ARDS).

DESIGN

Prospective, nonconsecutive patients with ALI/ARDS.

SETTING

Adult surgical, trauma, and medical intensive care units at a major inner-city, university-affiliated hospital.

PATIENTS

Ten patients with ALI/ARDS managed clinically with lung-protective ventilation.

INTERVENTIONS

Five patients were ventilated at a progressively smaller tidal volume in 1 mL/kg steps between 8 and 5 mL/kg; five other patients were ventilated at a progressively larger tidal volume from 5 to 8 mL/kg. The volume mode was used with a flow rate of 75 L/min. Minute ventilation was maintained constant at each tidal volume setting. Afterward, patients were placed on continuous positive airway pressure for 1-2 mins to measure their spontaneous tidal volume.

MEASUREMENTS AND MAIN RESULTS

Work of breathing and other variables were measured with a pulmonary mechanics monitor (Bicore CP-100). Work of breathing progressively increased (0.86 +/- 0.32, 1.05 +/- 0.40, 1.22 +/- 0.36, and 1.57 +/- 0.43 J/L) at a tidal volume of 8, 7, 6, and 5 mL/kg, respectively. In nine of ten patients there was a strong negative correlation between work of breathing and the ventilator-to-patient tidal volume difference (R = -.75 to -.998).

CONCLUSIONS

: The ventilator-delivered tidal volume exerts an independent influence on work of breathing during lung-protective ventilation in patients with ALI/ARDS. Patient work of breathing is inversely related to the difference between the ventilator-delivered tidal volume and patient-generated tidal volume during a brief trial of unassisted breathing.

Patient-ventilator asynchrony during non-invasive ventilation for acute respiratory failure: a multicenter study.

Vignaux L, Vargas F, Roeseler J, et al. Patient-ventilator asynchrony during non-invasive ventilation for acute respiratory failure: a multicenter study. Intensive Care Med. 2009;35(5):840-846. doi:10.1007/s00134-009-1416-5


OBJECTIVE

To determine the prevalence of patient-ventilator asynchrony in patients receiving non-invasive ventilation (NIV) for acute respiratory failure.

DESIGN

Prospective multicenter observation study.

SETTING

Intensive care units in three university hospitals.

METHODS

Patients consecutively admitted to ICU were included. NIV, performed with an ICU ventilator, was set by the clinician. Airway pressure, flow, and surface diaphragmatic electromyography were recorded continuously for 30 min. Asynchrony events and the asynchrony index (AI) were determined from visual inspection of the recordings and clinical observation.

RESULTS

A total of 60 patients were included, 55% of whom were hypercapnic. Auto-triggering was present in 8 (13%) patients, double triggering in 9 (15%), ineffective breaths in 8 (13%), premature cycling 7 (12%) and late cycling in 14 (23%). An AI > 10%, indicating severe asynchrony, was present in 26 patients (43%), whose median (25-75 IQR) AI was 26 (15-54%). A significant correlation was found between the magnitude of leaks and the number of ineffective breaths and severity of delayed cycling. Multivariate analysis indicated that the level of pressure support and the magnitude of leaks were weakly, albeit significantly, associated with an AI > 10%. Patient comfort scale was higher in pts with an AI < 10%.

CONCLUSION

Patient-ventilator asynchrony is common in patients receiving NIV for acute respiratory failure. Our results suggest that leaks play a major role in generating patient-ventilator asynchrony and discomfort, and point the way to further research to determine if ventilator functions designed to cope with leaks can reduce asynchrony in the clinical setting.

Related articles. Get a deeper look