Retour

La capnographie sous formes d'ondes de base : un outil de monitorage continu de la ventilation mécanique

Article

Auteur: Joe Hylton, MA, BSRT, RRT-ACCS/NPS, NRP, FAARC, FCCM, Clinical Applications Specialist, Hamilton Medical Inc.

Date: 15.07.2021

La capnographie sous formes d'ondes est bien connue des soins intensifs/médecine de soins critiques. Elle est largement utilisée comme outil de validation de gestion des voies aériennes et en sédation consciente, ainsi que pendant le transport intrahospitalier de patients intubés nécessitant une ventilation mécanique.  La capnographie sous formes d'ondes peut fournir des informations précieuses en temps utile au personnel soignant bien formé.

La capnographie sous formes d'ondes de base : un outil de monitorage continu de la ventilation mécanique

Facteurs physiologiques affectant le dioxyde de carbone de fin d'expiration (PetCO2)

Il existe plusieurs facteurs susceptibles d'affecter la quantité de dioxyde de carbone présente dans le gaz de fin d'expiration (PetCO2). En ce qui concerne l'élimination du CO2, il existe un quasi-équilibre constant entre la production de CO2 dans les tissus, son transport dans le sang, la diffusion dans les alvéoles et l'élimination par la ventilation (Kremeier P, Böhm SH, Tusman G. Clinical use of volumetric capnography in mechanically ventilated patients. J Clin Monit Comput. 2020;34(1):7-16. doi:10.1007/s10877-019-00325-91​). La capnographie fournit une représentation graphique du CO2 expiré et permet d'afficher de manière non invasive des informations en temps réel de la cinétique du CO2 chez des patients ventilés mécaniquement.

Une augmentation ou une diminution du taux métabolique du patient entraînera une modification de la production de CO2 et, par conséquent, également une élimination du CO2. Si la circulation et la ventilation sont stables (état qui ne peut être obtenu que chez des patients passifs ventilés mécaniquement) le monitorage du CO2 peut servir d'indicateur de la production de CO2. La fièvre, un sepsis, des douleurs et des convulsions constituent tous des conditions susceptibles d'augmenter le métabolisme, provoquant une hausse concomitante de la production de CO2 et, en conséquence, une augmentation de la PetCO2. Une diminution du métabolisme survient chez des patients en hypothermie ou sédatés et paralysés. Cela diminue la production de CO2 et peut entraîner une baisse de la PetCO2 si la ventilation minute n'augmente pas au même moment (Gravenstein, J., Jaffe, M., & Paulus, D. (2004). Capnography: Clinical Aspects. New York: Cambridge University Press.2​).

Le transport du CO2 vers les poumons s'appuie sur le bon fonctionnement cardiovasculaire. Par conséquent, tout facteur altérant la fonction cardiovasculaire peut également influer sur le transport du CO2 vers les poumons (Gravenstein, J., Jaffe, M., & Paulus, D. (2004). Capnography: Clinical Aspects. New York: Cambridge University Press.2​).

Le rejet du CO2 des poumons dans l'environnement est affecté par des modifications de la fonction respiratoire. Des maladies pulmonaires obstructives, une pneumonie, des troubles neuromusculaires et des troubles du système nerveux central qui entraînent des troubles de la fonction respiratoire impliqueront par conséquent une modification de la valeur de PetCO2 (Gravenstein, J., Jaffe, M., & Paulus, D. (2004). Capnography: Clinical Aspects. New York: Cambridge University Press.2​).

Types de capnographie

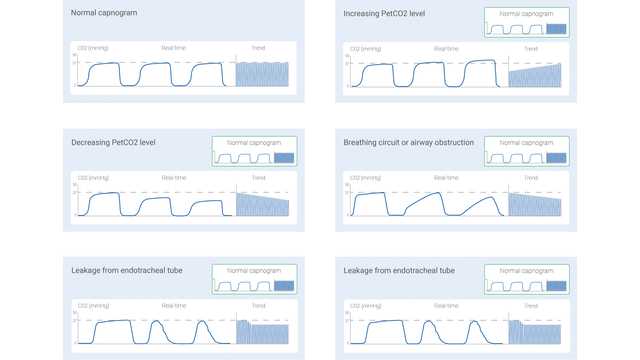
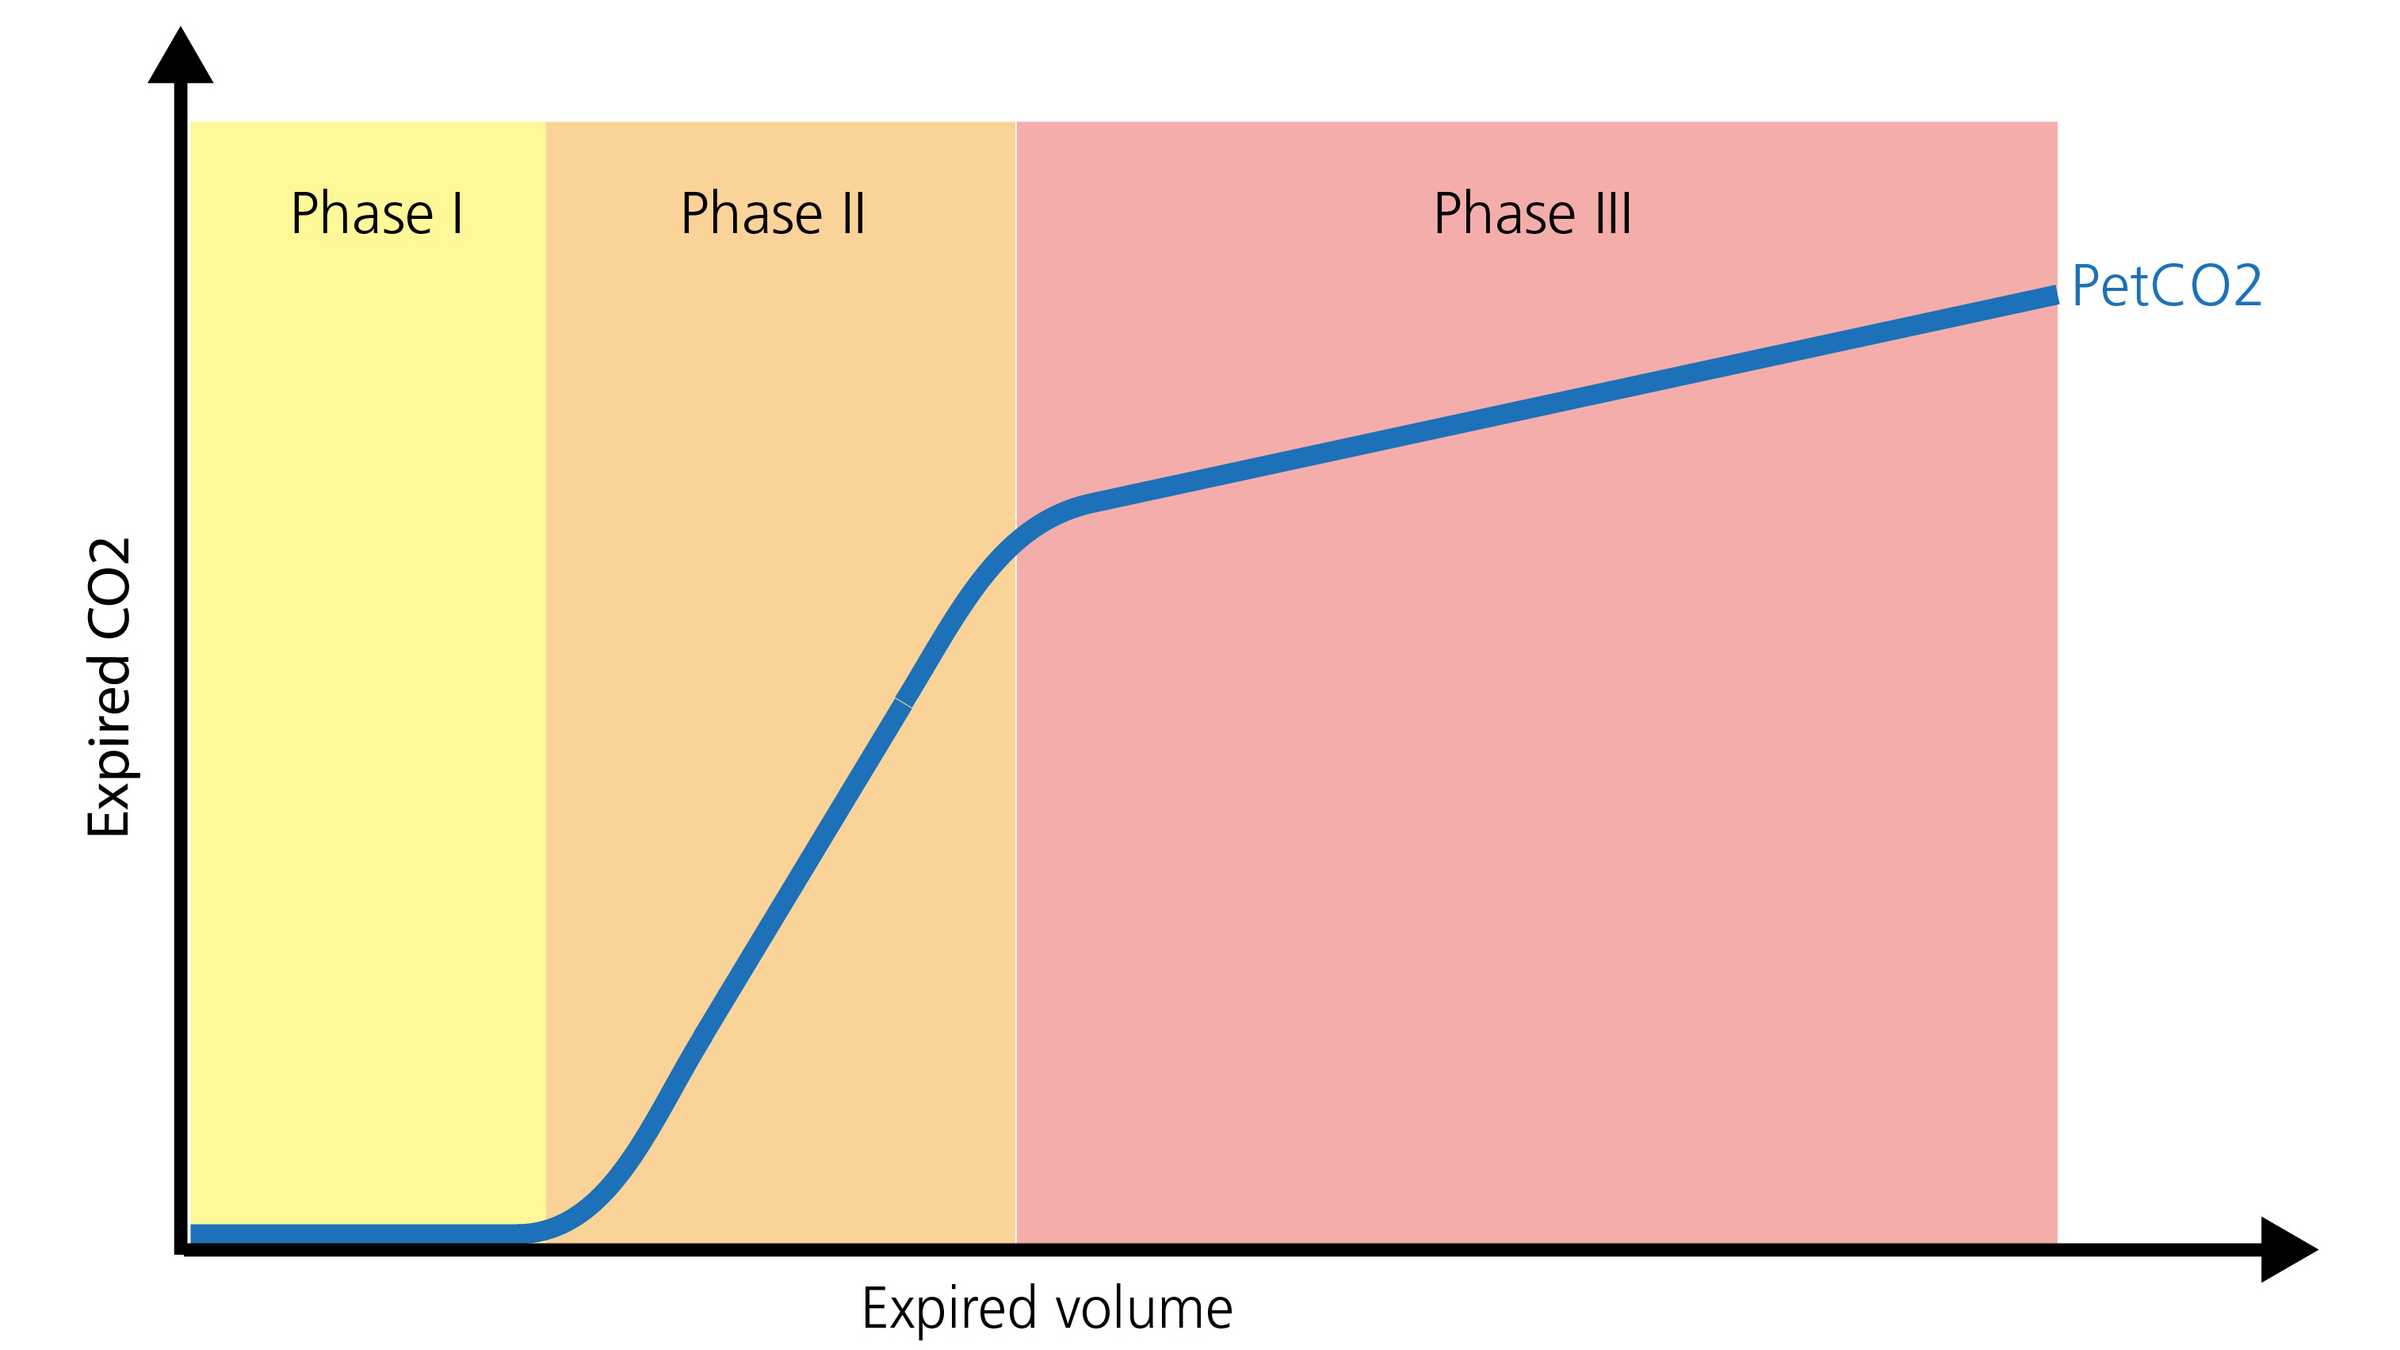
Le signal de CO2 mesuré peut être enregistré soit comme une fonction de temps (capnographie basée sur le temps) soit comme volume expiré (capnographie volumétrique). La quantité d'informations potentiellement fournie par ces deux différents types de capnographie varie considérablement. Certains profils de capnogramme basé sur le temps et considérés comme typiques dans des cas cliniques précis ont été décrits dans la littérature. Certains des cas courants sont représentés ci-dessous à la figure 1.

Cependant, la capnographie basée sur le temps présente également quelques limites : elle ne peut pas fournir d'estimation précise de l'état de ventilation-perfusion des poumons et ne peut pas servir à estimer le composant de l'espace mort physiologique. Même si la capnographie volumétrique n'est pas aussi simple et pratique que la capnographie basée sur le temps, elle présente l'avantage de fournir beaucoup plus d'informations.

Schémas de capnogrammes représentant des états courants
Figure 1
Schémas de capnogrammes représentant des états courants
Figure 1

Le capnogramme volumétrique – forme et phases

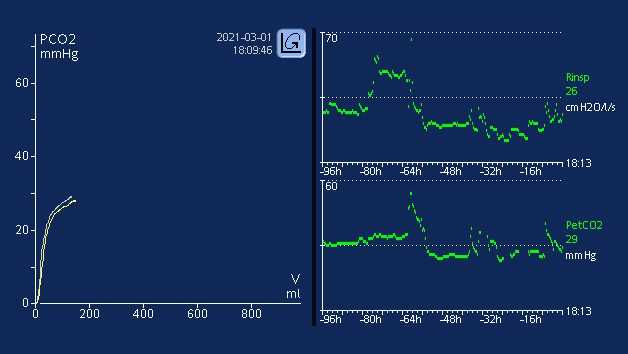
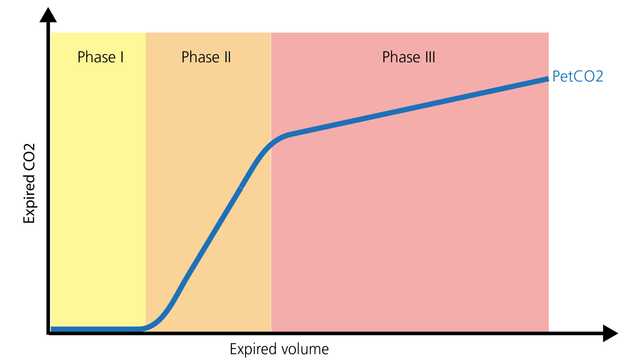
La forme normale d'un capnogramme volumétrique se compose de trois phases. Il est important de se rappeler que le capnogramne est représentatif de l'expiration.

  • La phase I représente le gaz exempt de CO2 provenant des voies aériennes (espace mort anatomique et supplémentaire).
  • La phase II est une phase de transition au cours de laquelle le gaz provenant des voies aériennes de conduction est mélangé au gaz alvéolaire.
  • La phase III est une phase plateau, se composant de gaz alvéolaires et de zones pulmonaires se vidant lentement (Gravenstein, J., Jaffe, M., & Paulus, D. (2004). Capnography: Clinical Aspects. New York: Cambridge University Press.2​). Une représentation visuelle est affichée ci-dessous sur la figure 2.
Schéma représentant trois phases
Figure 2
Schéma représentant trois phases
Figure 2

La capnographie pendant le transport

La capnographie, qu'elle soit basée sur le temps ou volumétrique, peut fournir des informations précieuses pour optimiser le monitorage et orienter les soins pour le patient nécessitant un transport intrahospitalier/interhospitalier. Elle peut être utilisée en toute sécurité avec des sondes d'intubation, des canules de trachéotomie et la plupart des voies aériennes supraglottiques, à condition que l'étanchéité soit efficace. La perméabilité et le positionnement des voies aériennes, le monitorage de la ventilation et le statut de la perfusion représentent tous des domaines dans lesquels la PetCO2 fournit des informations importantes. Le volume de dioxyde de carbone éliminé par minute (V'CO2) constitue un autre paramètre précieux ; il permet au personnel soignant d'évaluer l'efficacité de la perfusion et des efforts de réanimation en volume (I-Gnaidy E., Abo El-Nasr, L., Ameen, S., & Abd El-Ghafar, M. (2019). Correlation between Cardon Dioxide Production and Mean Arterial Blood Pressure in Fluid Response in Mechanically Ventilated Patients. Medical Journal of Cairo University, 87(4), 2679-2684.3​).

La capnographie en USI

En unité de soins intensifs, la capnographie sous formes d'ondes peut continuer le monitorage du positionnement et de la perméabilité des voies aériennes, avec divers dispositifs d'appoint de voies aériennes. Le ratio de l'espace mort par rapport au volume courant (VD/Vt) est une mesure importante de la capnographie.  Une augmentation du ratio VD/Vt peut représenter une hausse potentielle de la mortalité, en fonction du degré d'augmentation (Kallet RH, Alonso JA, Pittet JF, Matthay MA. Prognostic value of the pulmonary dead-space fraction during the first 6 days of acute respiratory distress syndrome. Respir Care. 2004;49(9):1008-1014. 4​, Nuckton TJ, Alonso JA, Kallet RH, et al. Pulmonary dead-space fraction as a risk factor for death in the acute respiratory distress syndrome. N Engl J Med. 2002;346(17):1281-1286. doi:10.1056/NEJMoa0128355​). Le personnel soignant peut utiliser la forme d'ondes de la PetCO2 et la V’CO2 pour optimiser le recrutement pulmonaire, pour valider les ajustements optimaux de PEP et pour identifier les problèmes de perfusion (systémique et pulmonaire) (Kallet RH, Alonso JA, Pittet JF, Matthay MA. Prognostic value of the pulmonary dead-space fraction during the first 6 days of acute respiratory distress syndrome. Respir Care. 2004;49(9):1008-1014. 4​, Nuckton TJ, Alonso JA, Kallet RH, et al. Pulmonary dead-space fraction as a risk factor for death in the acute respiratory distress syndrome. N Engl J Med. 2002;346(17):1281-1286. doi:10.1056/NEJMoa0128355​, Blankman P, Shono A, Hermans BJ, Wesselius T, Hasan D, Gommers D. Detection of optimal PEEP for equal distribution of tidal volume by volumetric capnography and electrical impedance tomography during decreasing levels of PEEP in post cardiac-surgery patients. Br J Anaesth. 2016;116(6):862-869. doi:10.1093/bja/aew1166​, Nguyen LS, Squara P. Non-Invasive Monitoring of Cardiac Output in Critical Care Medicine. Front Med (Lausanne). 2017;4:200. Published 2017 Nov 20. doi:10.3389/fmed.2017.002007​). La V’CO2 peut également être utilisée lors de la libération de la ventilation mécanique, pour permettre au personnel soignant d'identifier chez le patient une fatigue/insuffisance potentielle (augmentation de la fraction d'espace mort, effort inadéquat et fatigue des muscles respiratoires). La dépense d'énergie dérivée de la V’CO2 est une méthode précise que le personnel soignant peut utiliser pour calculer les besoins nutritionnels des patients ventilés mécaniquement (Stapel SN, de Grooth HJ, Alimohamad H, et al. Ventilator-derived carbon dioxide production to assess energy expenditure in critically ill patients: proof of concept. Crit Care. 2015;19:370. Published 2015 Oct 22. doi:10.1186/s13054-015-1087-28​).

Tous les ventilateurs Hamilton Medical fournissent une capnographie volumétrique (Tous les modèles à l'exception du HAMILTON-MR1A​), que ce soit en équipement standard ou en option. La mesure du CO2 est réalisée au moyen d'un capteur de CO2 « mainstream » CAPNOSTAT® 5 placé à l'entrée des voies aériennes du patient. En outre, ils offrent un aperçu de toutes les valeurs pertinentes associées au CO2 dans la fenêtre de monitorage du CO2.

E-book sur la capnographie volumétrique

E-book gratuit

Bon à savoir ! Tout sur la capnographie volumétrique

Apprenez à interpréter un capnogramme volumétrique et découvrez les avantages et les applications cliniques de la capnographie volumétrique. Inclut un auto-test !

Notes en bas de page

  • A. Tous modèles excepté HAMILTON-MR1

Références

  1. 1. Kremeier P, Böhm SH, Tusman G. Clinical use of volumetric capnography in mechanically ventilated patients. J Clin Monit Comput. 2020;34(1):7-16. doi:10.1007/s10877-019-00325-9
  2. 2. Gravenstein, J., Jaffe, M., & Paulus, D. (2004). Capnography: Clinical Aspects. New York: Cambridge University Press.
  3. 3. I-Gnaidy E., Abo El-Nasr, L., Ameen, S., & Abd El-Ghafar, M. (2019). Correlation between Cardon Dioxide Production and Mean Arterial Blood Pressure in Fluid Response in Mechanically Ventilated Patients. Medical Journal of Cairo University, 87(4), 2679-2684.
  4. 4. Kallet RH, Alonso JA, Pittet JF, Matthay MA. Prognostic value of the pulmonary dead-space fraction during the first 6 days of acute respiratory distress syndrome. Respir Care. 2004;49(9):1008-1014.
  5. 5. Nuckton TJ, Alonso JA, Kallet RH, et al. Pulmonary dead-space fraction as a risk factor for death in the acute respiratory distress syndrome. N Engl J Med. 2002;346(17):1281-1286. doi:10.1056/NEJMoa012835
  6. 6. Blankman P, Shono A, Hermans BJ, Wesselius T, Hasan D, Gommers D. Detection of optimal PEEP for equal distribution of tidal volume by volumetric capnography and electrical impedance tomography during decreasing levels of PEEP in post cardiac-surgery patients. Br J Anaesth. 2016;116(6):862-869. doi:10.1093/bja/aew116
  7. 7. Nguyen LS, Squara P. Non-Invasive Monitoring of Cardiac Output in Critical Care Medicine. Front Med (Lausanne). 2017;4:200. Published 2017 Nov 20. doi:10.3389/fmed.2017.00200
  8. 8. Stapel SN, de Grooth HJ, Alimohamad H, et al. Ventilator-derived carbon dioxide production to assess energy expenditure in critically ill patients: proof of concept. Crit Care. 2015;19:370. Published 2015 Oct 22. doi:10.1186/s13054-015-1087-2

Clinical use of volumetric capnography in mechanically ventilated patients.

Kremeier P, Böhm SH, Tusman G. Clinical use of volumetric capnography in mechanically ventilated patients. J Clin Monit Comput. 2020;34(1):7-16. doi:10.1007/s10877-019-00325-9

Capnography is a first line monitoring system in mechanically ventilated patients. Volumetric capnography supports noninvasive and breath-by-breath information at the bedside using mainstream CO2 and flow sensors placed at the airways opening. This volume-based capnography provides information of important body functions related to the kinetics of carbon dioxide. Volumetric capnography goes one step forward standard respiratory mechanics and provides a new dimension for monitoring of mechanical ventilation. The article discusses the role of volumetric capnography for the clinical monitoring of mechanical ventilation.

Capnography: Clinical Aspects

Gravenstein, J., Jaffe, M., & Paulus, D. (2004). Capnography: Clinical Aspects. New York: Cambridge University Press.

Correlation between Carbon Dioxide Production and Mean Arterial Blood Pressure in Fluid Response in Mechanically Ventilated Patients

I-Gnaidy E., Abo El-Nasr, L., Ameen, S., & Abd El-Ghafar, M. (2019). Correlation between Cardon Dioxide Production and Mean Arterial Blood Pressure in Fluid Response in Mechanically Ventilated Patients. Medical Journal of Cairo University, 87(4), 2679-2684.

Prognostic value of the pulmonary dead-space fraction during the first 6 days of acute respiratory distress syndrome.

Kallet RH, Alonso JA, Pittet JF, Matthay MA. Prognostic value of the pulmonary dead-space fraction during the first 6 days of acute respiratory distress syndrome. Respir Care. 2004;49(9):1008-1014.


BACKGROUND

The ratio of pulmonary dead space to tidal volume (VD/VT) in acute respiratory distress syndrome (ARDS) is reported to be between 0.35 and 0.55. However, VD/VT has seldom been measured with consideration to the evolving pathophysiology of ARDS.

METHODS

We made serial VD/VT measurements with 59 patients who required mechanical ventilation for > or = 6 days. We measured VD/VT within 24 h of the point at which the patient met the American-European Consensus Conference criteria for ARDS, and we repeated the VD/VT measurement on ARDS days 2, 3, and 6 with a bedside metabolic monitor during volume-regulated ventilation. We analyzed the changes in VD/VT over the 6-day period to determine whether VD/VT has a significant association with mortality.

RESULTS

VD/VT was significantly higher in nonsurvivors on day 1 (0.61 +/- 0.09 vs 0.54 +/- 0.08, p < 0.05), day 2 (0.63 +/- 0.09 vs 0.53 +/- 0.09, p < 0.001), day 3 (0.64 +/- 0.09 vs 0.53 +/- 0.09, p < 0.001), and day 6 (0.66 +/- 0.09 vs 0.51 +/- 0.08, p < 0.001).

CONCLUSION

In ARDS a sustained VD/VT elevation is characteristic of nonsurvivors, so dead-space measurements made beyond the first 24 hours may have prognostic value.

Pulmonary dead-space fraction as a risk factor for death in the acute respiratory distress syndrome.

Nuckton TJ, Alonso JA, Kallet RH, et al. Pulmonary dead-space fraction as a risk factor for death in the acute respiratory distress syndrome. N Engl J Med. 2002;346(17):1281-1286. doi:10.1056/NEJMoa012835


BACKGROUND

No single pulmonary-specific variable, including the severity of hypoxemia, has been found to predict the risk of death independently when measured early in the course of the acute respiratory distress syndrome. Because an increase in the pulmonary dead-space fraction has been described in observational studies of the syndrome, we systematically measured the dead-space fraction early in the course of the illness and evaluated its potential association with the risk of death.

METHODS

The dead-space fraction was prospectively measured in 179 intubated patients, a mean (+/-SD) of 10.9+/-7.4 hours after the acute respiratory distress syndrome had developed. Additional clinical and physiological variables were analyzed with the use of multiple logistic regression. The study outcome was mortality before hospital discharge.

RESULTS

The mean dead-space fraction was markedly elevated (0.58+/-0.09) early in the course of the acute respiratory distress syndrome and was higher among patients who died than among those who survived (0.63+/-0.10 vs. 0.54+/-0.09, P<0.001). The dead-space fraction was an independent risk factor for death: for every 0.05 increase, the odds of death increased by 45 percent (odds ratio, 1.45; 95 percent confidence interval, 1.15 to 1.83; P=0.002). The only other independent predictors of an increased risk of death were the Simplified Acute Physiology Score II, an indicator of the severity of illness (odds ratio, 1.06; 95 percent confidence interval, 1.03 to 1.08; P<0.001) and quasistatic respiratory compliance (odds ratio, 1.06; 95 percent confidence interval, 1.01 to 1.10; P=0.01).

CONCLUSIONS

Increased dead-space fraction is a feature of the early phase of the acute respiratory distress syndrome. Elevated values are associated with an increased risk of death.

Detection of optimal PEEP for equal distribution of tidal volume by volumetric capnography and electrical impedance tomography during decreasing levels of PEEP in post cardiac-surgery patients.

Blankman P, Shono A, Hermans BJ, Wesselius T, Hasan D, Gommers D. Detection of optimal PEEP for equal distribution of tidal volume by volumetric capnography and electrical impedance tomography during decreasing levels of PEEP in post cardiac-surgery patients. Br J Anaesth. 2016;116(6):862-869. doi:10.1093/bja/aew116


BACKGROUND

Homogeneous ventilation is important for prevention of ventilator-induced lung injury. Electrical impedance tomography (EIT) has been used to identify optimal PEEP by detection of homogenous ventilation in non-dependent and dependent lung regions. We aimed to compare the ability of volumetric capnography and EIT in detecting homogenous ventilation between these lung regions.

METHODS

Fifteen mechanically-ventilated patients after cardiac surgery were studied. Ventilator settings were adjusted to volume-controlled mode with a fixed tidal volume (Vt) of 6-8 ml kg(-1) predicted body weight. Different PEEP levels were applied (14 to 0 cm H2O, in steps of 2 cm H2O) and blood gases, Vcap and EIT were measured.

RESULTS

Tidal impedance variation of the non-dependent region was highest at 6 cm H2O PEEP, and decreased significantly at 14 cm H2O PEEP indicating decrease in the fraction of Vt in this region. At 12 cm H2O PEEP, homogenous ventilation was seen between both lung regions. Bohr and Enghoff dead space calculations decreased from a PEEP of 10 cm H2O. Alveolar dead space divided by alveolar Vt decreased at PEEP levels ≤6 cm H2O. The normalized slope of phase III significantly changed at PEEP levels ≤4 cm H2O. Airway dead space was higher at higher PEEP levels and decreased at the lower PEEP levels.

CONCLUSIONS

In postoperative cardiac patients, calculated dead space agreed well with EIT to detect the optimal PEEP for an equal distribution of inspired volume, amongst non-dependent and dependent lung regions. Airway dead space reduces at decreasing PEEP levels.

Non-Invasive Monitoring of Cardiac Output in Critical Care Medicine.

Nguyen LS, Squara P. Non-Invasive Monitoring of Cardiac Output in Critical Care Medicine. Front Med (Lausanne). 2017;4:200. Published 2017 Nov 20. doi:10.3389/fmed.2017.00200

Critically ill patients require close hemodynamic monitoring to titrate treatment on a regular basis. It allows administering fluid with parsimony and adjusting inotropes and vasoactive drugs when necessary. Although invasive monitoring is considered as the reference method, non-invasive monitoring presents the obvious advantage of being associated with fewer complications, at the expanse of accuracy, precision, and step-response change. A great many methods and devices are now used over the world, and this article focuses on several of them, providing with a brief review of related underlying physical principles and validation articles analysis. Reviewed methods include electrical bioimpedance and bioreactance, respiratory-derived cardiac output (CO) monitoring technique, pulse wave transit time, ultrasound CO monitoring, multimodal algorithmic estimation, and inductance thoracocardiography. Quality criteria with which devices were reviewed included: accuracy (closeness of agreement between a measurement value and a true value of the measured), precision (closeness of agreement between replicate measurements on the same or similar objects under specified conditions), and step response change (delay between physiological change and its indication). Our conclusion is that the offer of non-invasive monitoring has improved in the past few years, even though further developments are needed to provide clinicians with sufficiently accurate devices for routine use, as alternative to invasive monitoring devices.

Ventilator-derived carbon dioxide production to assess energy expenditure in critically ill patients: proof of concept.

Stapel SN, de Grooth HJ, Alimohamad H, et al. Ventilator-derived carbon dioxide production to assess energy expenditure in critically ill patients: proof of concept. Crit Care. 2015;19:370. Published 2015 Oct 22. doi:10.1186/s13054-015-1087-2


INTRODUCTION

Measurement of energy expenditure (EE) is recommended to guide nutrition in critically ill patients. Availability of a gold standard indirect calorimetry is limited, and continuous measurement is unfeasible. Equations used to predict EE are inaccurate. The purpose of this study was to provide proof of concept that EE can be accurately assessed on the basis of ventilator-derived carbon dioxide production (VCO2) and to determine whether this method is more accurate than frequently used predictive equations.

METHODS

In 84 mechanically ventilated critically ill patients, we performed 24-h indirect calorimetry to obtain a gold standard EE. Simultaneously, we collected 24-h ventilator-derived VCO2, extracted the respiratory quotient of the administered nutrition, and calculated EE with a rewritten Weir formula. Bias, precision, and accuracy and inaccuracy rates were determined and compared with four predictive equations: the Harris-Benedict, Faisy, and Penn State University equations and the European Society for Clinical Nutrition and Metabolism (ESPEN) guideline equation of 25 kcal/kg/day.

RESULTS

Mean 24-h indirect calorimetry EE was 1823 ± 408 kcal. EE from ventilator-derived VCO2 was accurate (bias +141 ± 153 kcal/24 h; 7.7 % of gold standard) and more precise than the predictive equations (limits of agreement -166 to +447 kcal/24 h). The 10 % and 15 % accuracy rates were 61 % and 76 %, respectively, which were significantly higher than those of the Harris-Benedict, Faisy, and ESPEN guideline equations. Large errors of more than 30 % inaccuracy did not occur with EE derived from ventilator-derived VCO2. This 30 % inaccuracy rate was significantly lower than that of the predictive equations.

CONCLUSIONS

In critically ill mechanically ventilated patients, assessment of EE based on ventilator-derived VCO2 is accurate and more precise than frequently used predictive equations. It allows for continuous monitoring and is the best alternative to indirect calorimetry.

Related articles. Get a deeper look