Retour

Pressure target increase in P/V Tool® vs. continuous low flow

Article

Auteur: Simon Franz

Date: 05.06.2020

Does the Hamilton Medical P/V Tool provide a real low-flow pressure/volume (P/V) loop?
Pressure target increase in P/V Tool® vs. continuous low flow

Inflation

The Hamilton Medical P/V Tool is a pressure-targeted method for producing a quasi-static P/V loop.

Flows of less than or equal to 10 l/min seem to be quick, safe, and reliable for determining the lung mechanics by means of a P/V loop at the bedside.

We suggest using the minimum ramp speed of 2 cmH2O/s to eliminate the pressure change from resistive elements of the respiratory system (Albaiceta GM, Taboada F, Parra D, et al. Tomographic study of the inflection points of the pressure-volume curve in acute lung injury. Am J Respir Crit Care Med. 2004;170(10):1066-1072. doi:10.1164/rccm.200312-1644OC1​).

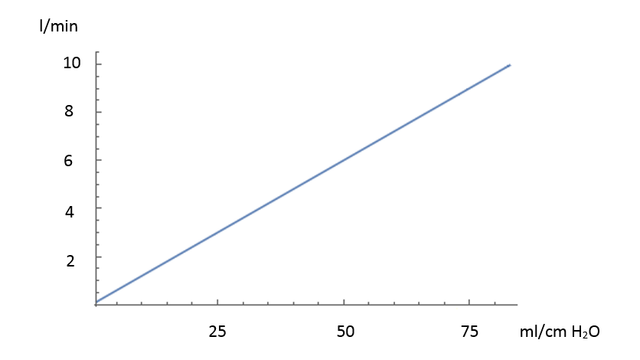
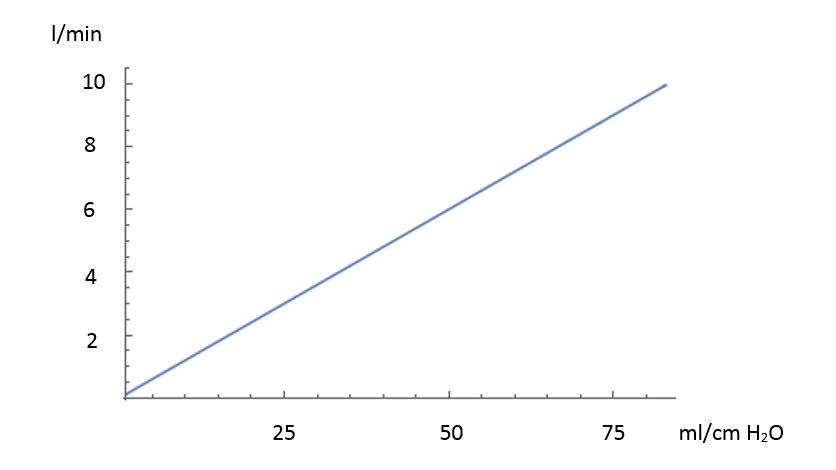
When following these recommendations, the flow should be below 10 l/min up to a compliance of 75 ml/cm H2O (see Figure 1). Most patients assessed for lung recruitability have a respiratory system compliance of less than 75 ml/cmH2O.

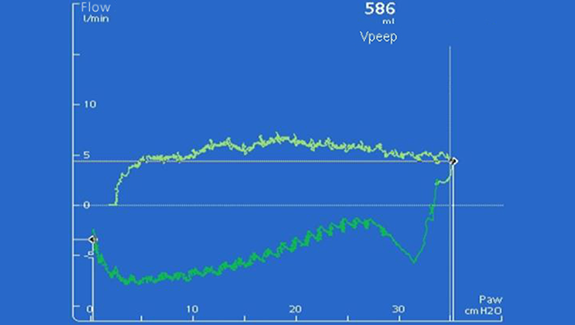
The flow can also be visualized by adding a Paw/Flow plot to the screen (see Figure 2).

Graph showing relationship of static compliance on x-axis and flow on y-axis
Figure 1: Static compliance/flow relationship at a ramp speed of 2 cmH2O/s
Graph showing relationship of static compliance on x-axis and flow on y-axis
Figure 1: Static compliance/flow relationship at a ramp speed of 2 cmH2O/s
Screenshot of ventilator display showing airway pressure and flow plot
Figure 2: Paw/Flow plot
Screenshot of ventilator display showing airway pressure and flow plot
Figure 2: Paw/Flow plot

Deflation

It is not possible to have control of the expiratory flow, because it is driven by the elastic recoil of the respiratory system. Deriving the deflation limb by means of a pressure-control approach is a reliable method that shows a good correlation with the radiological findings of a CT-scan (Blanc Q, Sab JM, Philit F, et al. Inspiratory pressure-volume curves obtained using automated low constant flow inflation and automated occlusion methods in ARDS patients with a new device. Intensive Care Med. 2002;28(7):990-994. doi:10.1007/s00134-002-1316-42​).

Assess lung recruitability and perform recruitment maneuvers

With the P/V Tool on selected ventilators (Available as an option on HAMILTON-G5 and HAMILTON-C3/C6 ventilatorsA​, Standard on the HAMILTON-S1B​​), Hamilton Medical provides a real low-flow pressure/volume loop for assessing lung recruitability. In addition, the P/V Tool can be used for reproducible, standardized and documentable lung recruitment maneuvers. Please refer to the documents available for download below for more information on using the P/V Tool.

Relevant devices: HAMILTON-G5/S1 (sw v2.8x), HAMILTON-C3 (sw v2.0.x), HAMILTON-C6 (sw v1.1.x)

Tomographic study of the inflection points of the pressure-volume curve in acute lung injury.

Albaiceta GM, Taboada F, Parra D, et al. Tomographic study of the inflection points of the pressure-volume curve in acute lung injury. Am J Respir Crit Care Med. 2004;170(10):1066-1072. doi:10.1164/rccm.200312-1644OC

The inflection points of the pressure-volume curve have been used for setting mechanical ventilation in patients with acute lung injury. However, the lung status at these points has never been specifically addressed. In 12 patients with early lung injury we traced both limbs of the pressure-volume curve by means of a stepwise change in airway pressure, and a computed tomography (CT) scan slice was obtained for every pressure level. Although aeration (increase in normally aerated lung) and recruitment (decrease in nonaerated lung) were parallel and continuous along the pressure axis during inflation, loss of aeration and derecruitment were only significant at pressures below the point of maximum curvature on the deflation limb of the pressure-volume curve. This point was related to a higher amount of normally aerated tissue and a lower amount of nonaerated tissue when compared with the lower inflection point on both limbs of the curve. Aeration at the inflection points was similar in lung injury from pulmonary or extrapulmonary origin. There were no significant changes in hyperinflated lung tissue. These results support the use of the deflation limb of the pressure-volume curve for positive end-expiratory pressure setting in patients with acute lung injury.

Inspiratory pressure-volume curves obtained using automated low constant flow inflation and automated occlusion methods in ARDS patients with a new device.

Blanc Q, Sab JM, Philit F, et al. Inspiratory pressure-volume curves obtained using automated low constant flow inflation and automated occlusion methods in ARDS patients with a new device. Intensive Care Med. 2002;28(7):990-994. doi:10.1007/s00134-002-1316-4


OBJECTIVE

To compare the inspiratory volume pressure (VP) curves of the respiratory system (rs) produced by static occlusion (OCC) and dynamic low constant flow inflation (LCFI) methods using a new device in acute respiratory distress syndrome (ARDS) patients.

SETTING

A multidisciplinary 24-bed ICU in a tertiary university hospital.

PATIENTS

Eleven intubated and mechanically ventilated patients with ARDS.

MEASUREMENTS AND RESULTS

OCC and LCFI methods were performed using the same ventilator, which had been specifically implemented for this purpose. LCFI of 5, 10, and 15 l/min and OCC were applied in a random order at zero end-expiratory positive pressure. Airway pressure was measured both proximal (P(ao)) and distal (P(tr)) to the endotracheal tube. Lower inflection point (LIP) and maximal slope (C(max,rs)) were estimated using unbiased iterative linear regressions. LIP(rs) was obtained in all patients under LCFI and in nine patients under OCC. With LCFI of 5, 10, 15 l/min and OCC the average LIP(rs) values were 12.2 +/- 3.9, 12.9 +/- 4, 14.3 +/- 3.4, and 11.9 cm H(2)O for P(ao) and 11.9 +/- 3.9, 11.5 +/- 3.3, 12.5 +/- 3.4 and 11.8 +/- 4.4 for P(tr), respectively. Only the mean values of LIP(rs) for P(ao) with LCFI at 15 l/min were significantly different from those obtained for OCC. The C(max,rs) values found with the two methods were similar.

CONCLUSIONS

An LCFI less than or equal to 10 l/min seems to be a quick, safe, and reliable method to determine LIP(rs) and C(max,rs) at the bedside.