Auteur: Jean-Michel Arnal, Senior Intensivist, Hopital Sainte Musse, Toulon, France
Date: 04.12.2023
What are the oscillations on the P-V curve? Keep reading for the full story!
A 74-year-old woman with a medical history of breast cancer treated by chemotherapy was admitted to the ICU for severe ARDS attributed to pneumonia. An esophageal catheter was inserted and a P-V curve was performed.
What are the small oscillations visible on the inflation and deflation limbs of the P-V curves shown below?
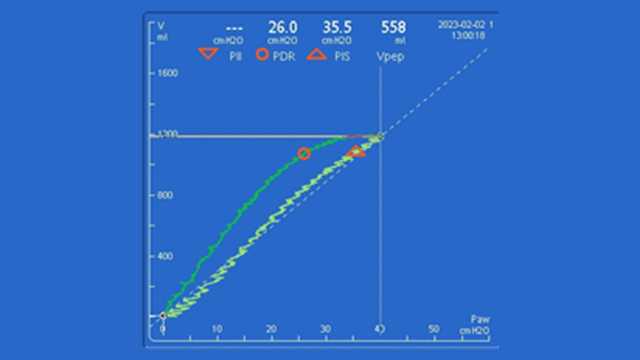

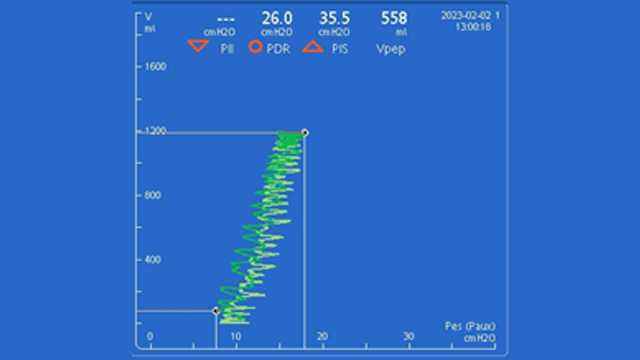

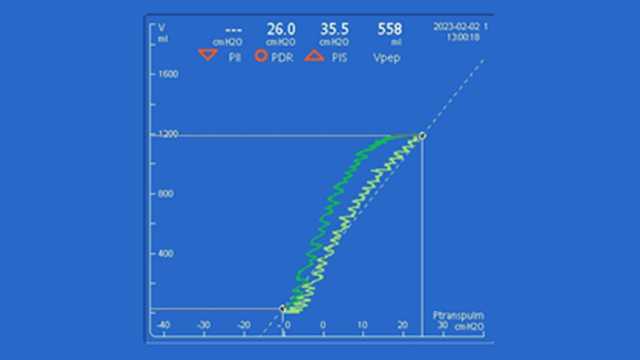
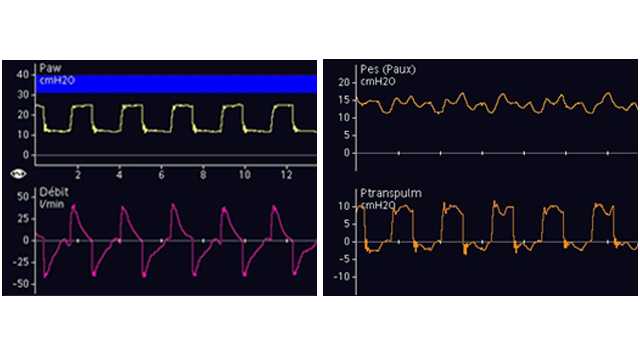
The small oscillations correspond with the transmission of cardiogenic oscillations. Note that the oscillations are greater on the esophageal pressure-volume curve and the transpulmonary pressure-volume curve. This is in line with the waveforms that show greater oscillations on esophageal pressure measurements when compared to airway pressure (see Fig. 4 below).