Indietro

Le curve capnografiche essenziali come strumento di monitoraggio continuo durante la ventilazione meccanica

Articolo

Autore: Joe Hylton, MA, BSRT, RRT-ACCS/NPS, NRP, FAARC, FCCM, Specialista applicazioni cliniche, Hamilton Medical Inc.

Data: 15.07.2021

Le curve capnografiche sono ben note nel campo della medicina intensiva. Sono uno strumento molto utilizzato per confermare la validità dell'approccio alla gestione delle vie aeree e nell'ambito della sedazione cosciente, ma anche durante il trasporto tra una struttura e l'altra dei pazienti intubati e sottoposti a ventilazione meccanica.  Le curve capnografiche possono fornire tempestivamente informazioni preziose al personale sanitario correttamente formato.

Le curve capnografiche essenziali come strumento di monitoraggio continuo durante la ventilazione meccanica

Fattori fisiologici che influiscono sull'end-tidal CO2 (PetCO2)

Sono molti i fattori che possono influenzare la quantità di anidride carbonica presente nel gas espirato nella fase cosiddetta "end-tidal" (PetCO2). Per garantire l'eliminazione della CO2 si ha un equilibrio preciso e continuo tra la produzione di CO2 nei tessuti, il suo trasporto nel sangue, la diffusione negli alveoli e l'eliminazione attraverso la ventilazione (Kremeier P, Böhm SH, Tusman G. Clinical use of volumetric capnography in mechanically ventilated patients. J Clin Monit Comput. 2020;34(1):7-16. doi:10.1007/s10877-019-00325-91). La capnografia fornisce una rappresentazione grafica della CO2 espirata e costituisce un metodo non invasivo per visualizzare informazioni in tempo reale sulla cinetica della CO2 nei pazienti ventilati meccanicamente.

Un aumento o una riduzione del tasso metabolico del paziente determina una variazione nella produzione della CO2 e, di conseguenza, anche nella sua eliminazione. Se la circolazione e la ventilazione sono entrambe stabili (uno stato che si ottiene solo nei pazienti passivi ventilati meccanicamente) il monitoraggio della CO2 può essere utilizzato come indicatore della produzione della CO2. Febbre, sepsi, dolore e crisi convulsive sono tutte condizioni che aumentano il metabolismo, provocando un corrispondente aumento nella produzione della CO2 e quindi un aumento della PetCO2. Si verifica invece una riduzione del metabolismo nei pazienti ipotermici o sedati e paralizzati. Queste condizioni riducono la produzione di CO2 e possono portare a una diminuzione della PetCO2 se non si ha un contemporaneo aumento della ventilazione minuto (Gravenstein, J., Jaffe, M., & Paulus, D. (2004). Capnography: Clinical Aspects. New York: Cambridge University Press.2).

Il trasporto di CO2 verso i polmoni dipende dal corretto funzionamento del sistema cardiovascolare, quindi qualsiasi fattore che altera la funzionalità cardiovascolare può influenzare anche il trasporto della CO2 verso i polmoni (Gravenstein, J., Jaffe, M., & Paulus, D. (2004). Capnography: Clinical Aspects. New York: Cambridge University Press.2).

La rimozione della CO2 che fuoriesce dai polmoni e viene riversata nell'ambiente è influenzata dalle variazioni della funzionalità respiratoria. Le patologie polmonari ostruttive, la polmonite, i disturbi neuromuscolari e quelli del sistema nervoso centrale che compromettono la funzionalità respiratoria causano quindi una variazione del valore della PetCO2 (Gravenstein, J., Jaffe, M., & Paulus, D. (2004). Capnography: Clinical Aspects. New York: Cambridge University Press.2).

Tipi di capnografia

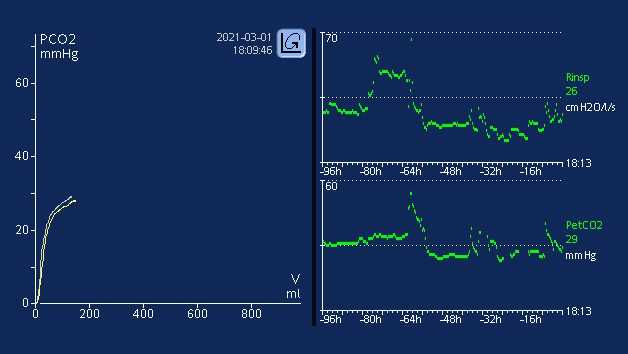
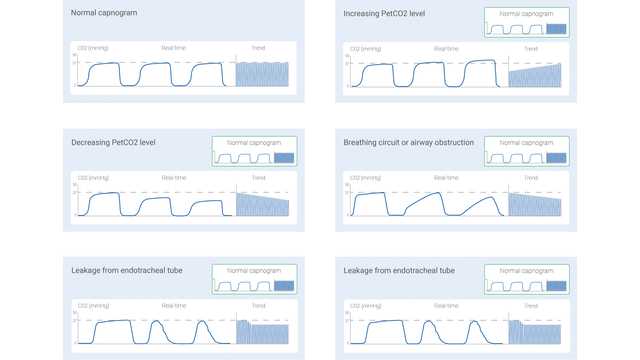
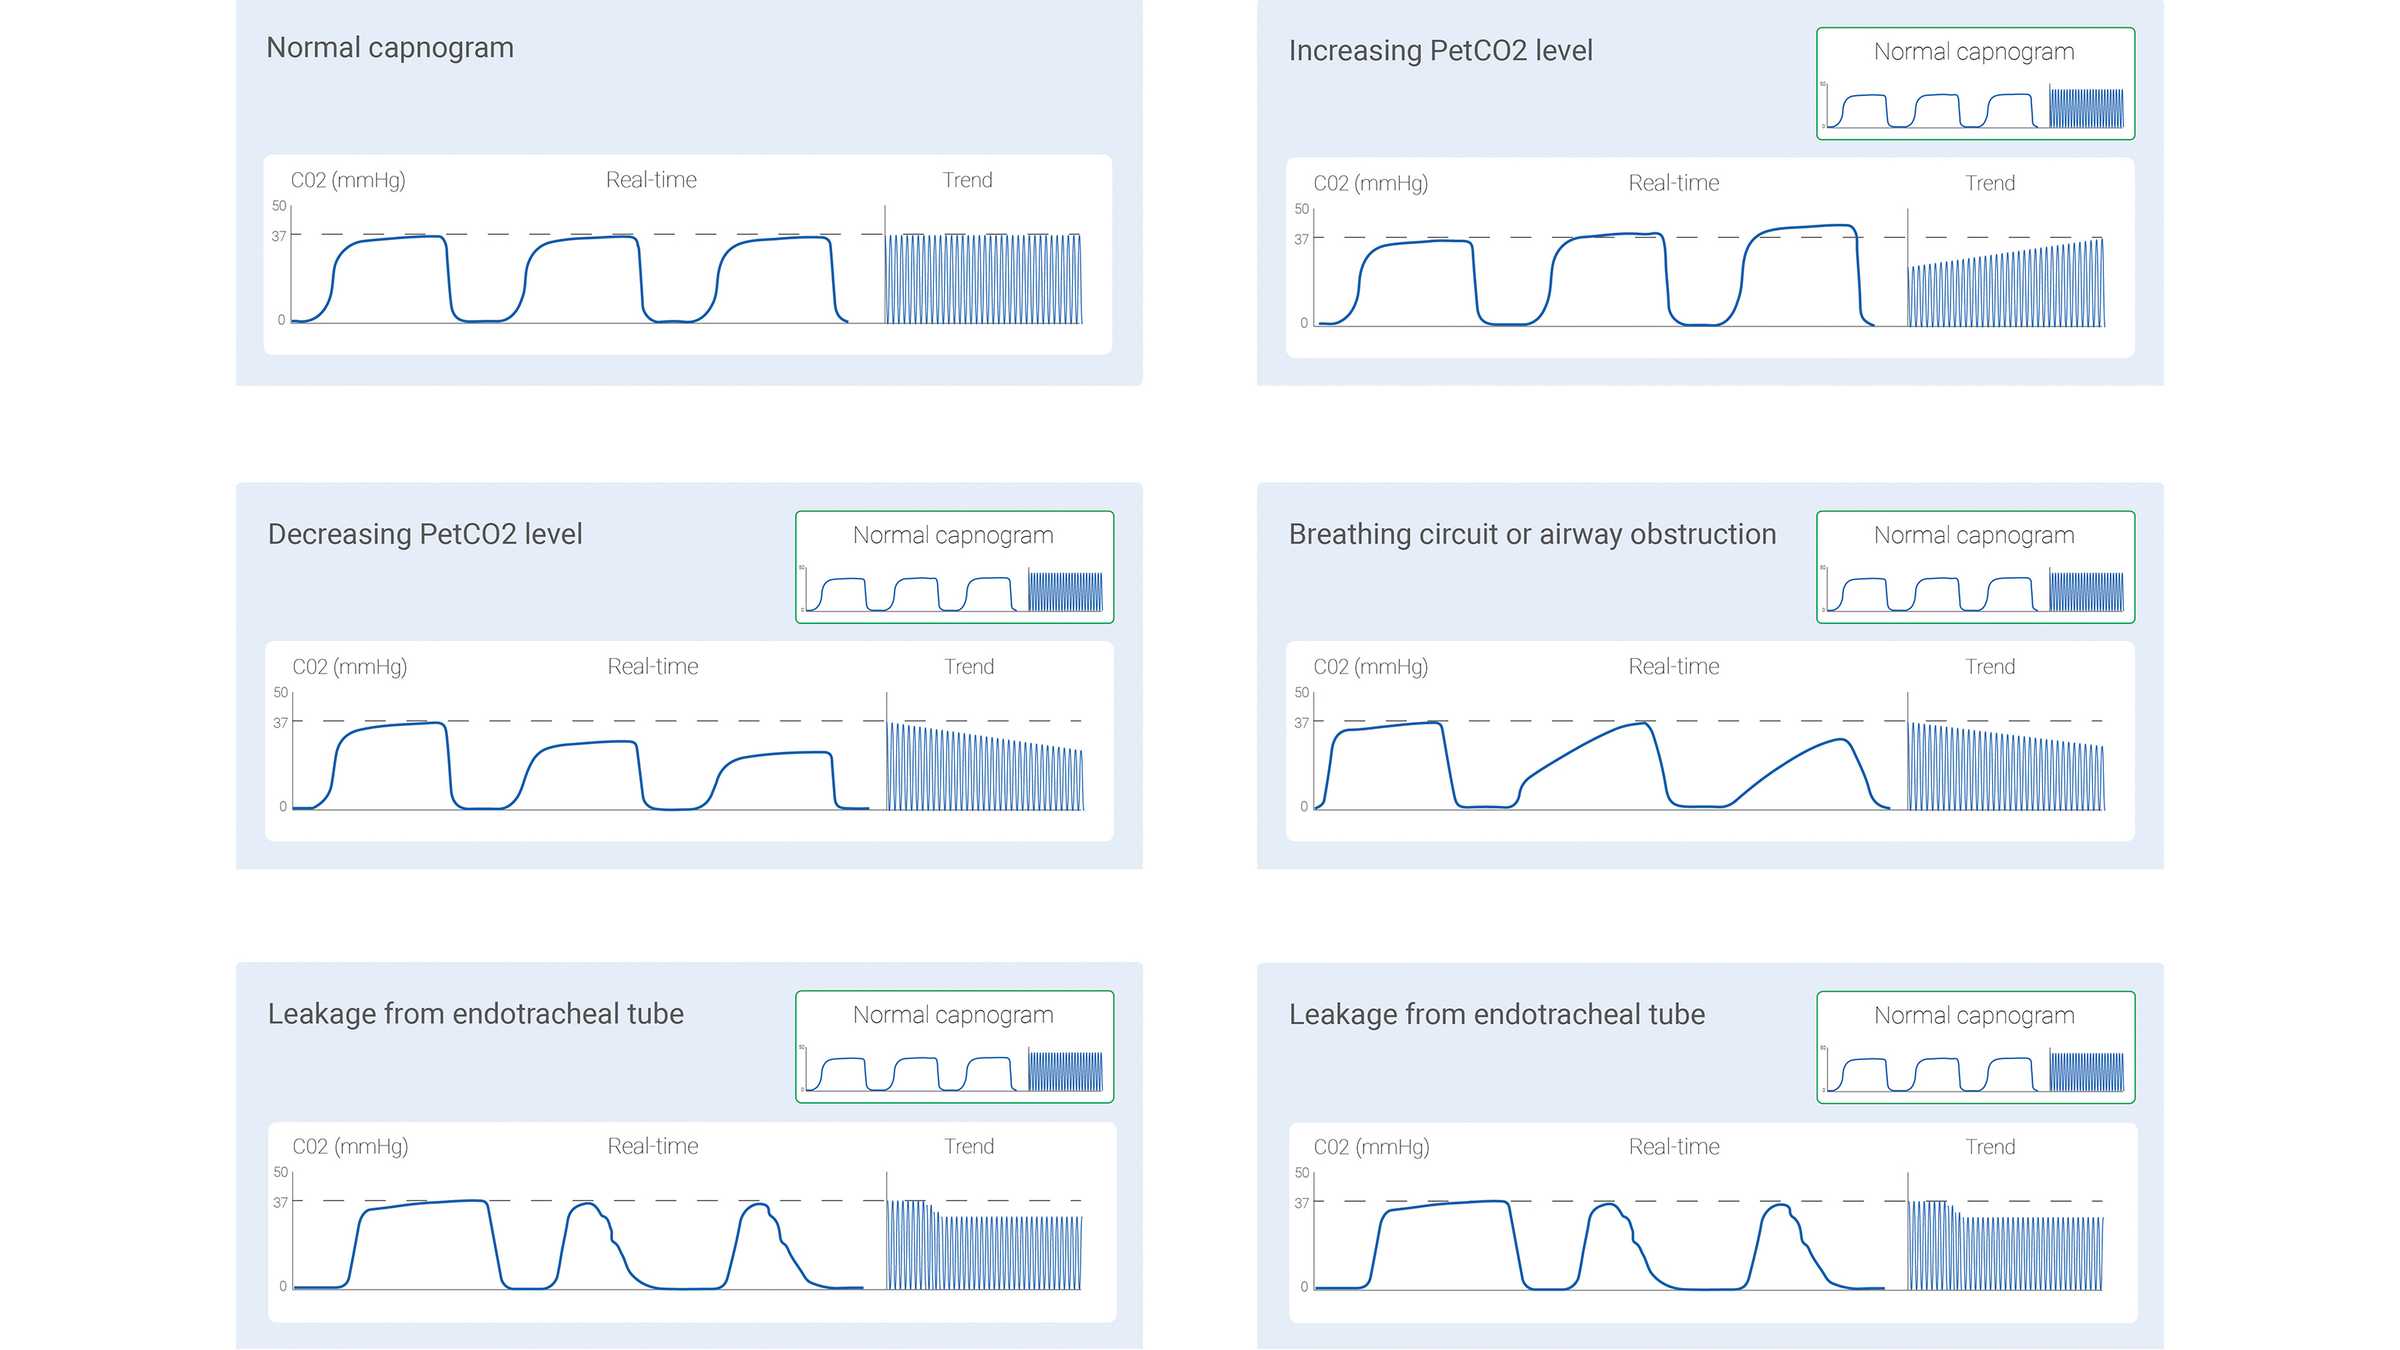
Il segnale di CO2 misurato può essere registrato come funzione del tempo (capnografia basata sul tempo) o del volume espirato (capnografia volumetrica). La quantità di dati potenzialmente forniti da questi due diversi tipi di capnografia varia significativamente. In letteratura sono stati descritti alcuni pattern dei capnogrammi basati sul tempo che vengono ritenuti tipici di determinate situazioni cliniche. Alcuni dei più comuni sono mostrati di seguito, nella Figura 1.

Anche la capnografia basata sul tempo ha però dei limiti: non è in grado di fornire una stima accurata dello stato di ventilazione/perfusione dei polmoni e non può essere utilizzata per fare una stima della componente di spazio morto fisiologico. Nonostante non sia semplice e pratica come la capnografia basata sul tempo, la capnografia volumetrica ha il vantaggio di fornire molte più informazioni.

Diagrammi che mostrano i capnogrammi di alcuni stati comuni
Figura 1
Diagrammi che mostrano i capnogrammi di alcuni stati comuni
Figura 1

Il capnogramma volumetrico: forma e fasi

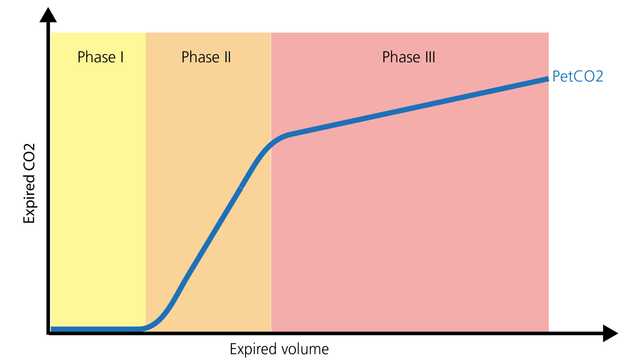
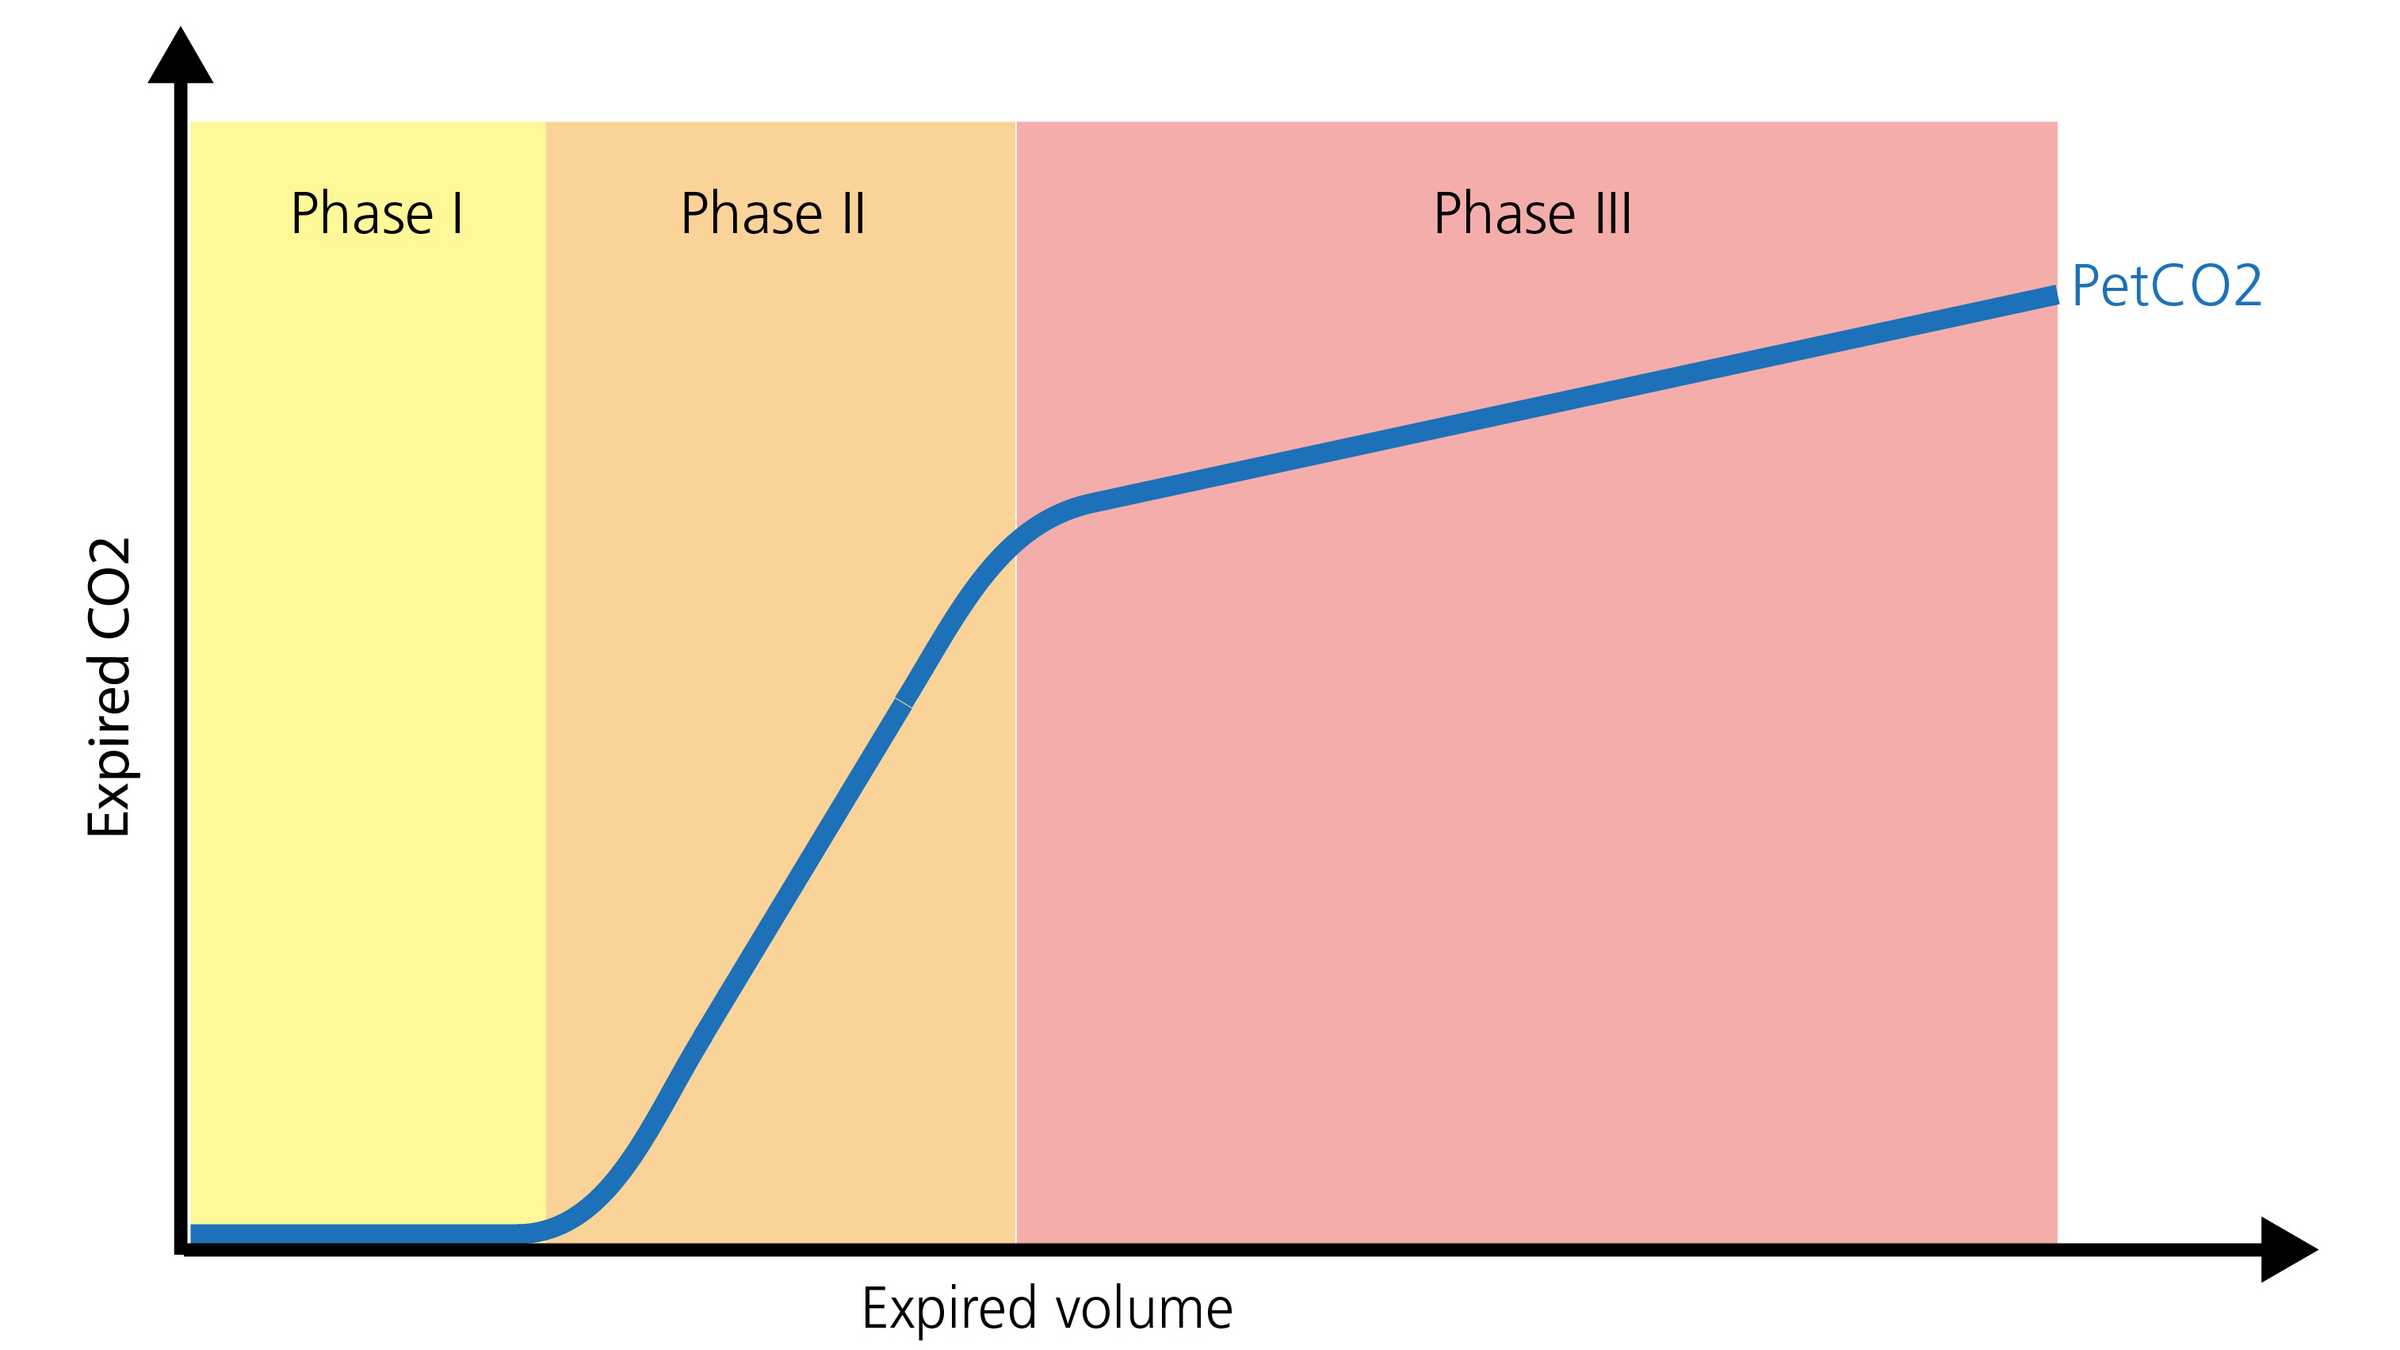
La forma normale di un capnogramma volumetrico è composta da tre fasi. È importante ricordare che il capnogramma rappresenta l'espirazione.

  • La fase I rappresenta il gas senza la CO2 proveniente dalle vie aeree (spazio morto anatomico e dovuto agli strumenti).
  • La fase II è una fase di transizione in cui il gas proveniente dai canali delle vie aeree si unisce al gas alveolare.
  • La fase III è una fase di plateau, a cui contribuiscono il gas proveniente dagli alveoli e dalle aree dei polmoni che si svuotano lentamente (Gravenstein, J., Jaffe, M., & Paulus, D. (2004). Capnography: Clinical Aspects. New York: Cambridge University Press.2). Di seguito, nella Figura 2, è riportata una rappresentazione delle tre fasi.
Diagramma che mostra le tre fasi
Figura 2
Diagramma che mostra le tre fasi
Figura 2

La capnografia durante il trasporto

La capnografia, sia essa basata sul tempo o volumetrica, è in grado di fornire informazioni preziose per ottimizzare il monitoraggio e guidare l'assistenza dei pazienti che devono essere trasportati all'interno dell'ospedale o da una struttura a un'altra. Può essere utilizzata in modo sicuro con tubi endotracheali, tubi tracheostomici e molte vie aeree sopraglottiche, purché la tenuta sia efficace. Il posizionamento e la pervietà delle vie aeree, il monitoraggio della ventilazione e lo stato di perfusione sono tutti ambiti in cui la PetCO2 fornisce informazioni significative. Un altro parametro prezioso è il volume dell'anidride carbonica eliminata al minuto (V'CO2), che consente al personale sanitario di valutare l'efficacia della perfusione e gli sforzi di reclutamento del volume (I-Gnaidy E., Abo El-Nasr, L., Ameen, S., & Abd El-Ghafar, M. (2019). Correlation between Cardon Dioxide Production and Mean Arterial Blood Pressure in Fluid Response in Mechanically Ventilated Patients. Medical Journal of Cairo University, 87(4), 2679-2684.3).

La capnografia in terapia intensiva

Nel reparto di terapia intensiva, le curve capnografiche permettono il monitoraggio continuo del posizionamento e della pervietà delle vie aeree, fornendo anche una serie di dati aggiuntivi sulle vie aeree. Il rapporto tra spazio morto e volume corrente (VD/Vt) è un parametro capnografico importante.  Un aumento del rapporto VD/Vt può riflettere un potenziale aumento della mortalità, a seconda dell'entità dell'aumento (Kallet RH, Alonso JA, Pittet JF, Matthay MA. Prognostic value of the pulmonary dead-space fraction during the first 6 days of acute respiratory distress syndrome. Respir Care. 2004;49(9):1008-1014. 4, Nuckton TJ, Alonso JA, Kallet RH, et al. Pulmonary dead-space fraction as a risk factor for death in the acute respiratory distress syndrome. N Engl J Med. 2002;346(17):1281-1286. doi:10.1056/NEJMoa0128355). Il personale sanitario può utilizzare le curve di PetCO2 e V'CO2 per ottimizzare il reclutamento polmonare, convalidare regolazioni ottimali della PEEP e identificare i problemi di perfusione (sistemica e polmonare) (Kallet RH, Alonso JA, Pittet JF, Matthay MA. Prognostic value of the pulmonary dead-space fraction during the first 6 days of acute respiratory distress syndrome. Respir Care. 2004;49(9):1008-1014. 4, Nuckton TJ, Alonso JA, Kallet RH, et al. Pulmonary dead-space fraction as a risk factor for death in the acute respiratory distress syndrome. N Engl J Med. 2002;346(17):1281-1286. doi:10.1056/NEJMoa0128355, Blankman P, Shono A, Hermans BJ, Wesselius T, Hasan D, Gommers D. Detection of optimal PEEP for equal distribution of tidal volume by volumetric capnography and electrical impedance tomography during decreasing levels of PEEP in post cardiac-surgery patients. Br J Anaesth. 2016;116(6):862-869. doi:10.1093/bja/aew1166, Nguyen LS, Squara P. Non-Invasive Monitoring of Cardiac Output in Critical Care Medicine. Front Med (Lausanne). 2017;4:200. Pubblicato il 20 novembre 2017. doi:10.3389/fmed.2017.002007). V'CO2 può essere utilizzato anche durante lo svezzamento dalla ventilazione meccanica e consente al personale sanitario di identificare i casi di potenziale affaticamento/inefficacia del paziente (aumento della frazione di spazio morto, sforzi inadeguati e affaticamento dei muscoli respiratori). La valutazione del dispendio energetico dovuto a V'CO2 è un metodo accurato e preciso che il personale sanitario può utilizzare per calcolare le esigenze nutrizionali dei pazienti ventilati meccanicamente (Stapel SN, de Grooth HJ, Alimohamad H, et al. Ventilator-derived carbon dioxide production to assess energy expenditure in critically ill patients: proof of concept. Crit Care. 2015;19:370. Pubblicato il 22 ottobre 2015. doi:10.1186/s13054-015-1087-28).

Tutti i ventilatori Hamilton Medical eseguono la capnografia volumetrica (Tutti i modelli eccetto l'HAMILTON-MR1A) come funzione di serie oppure opzionale. La misurazione della CO2 viene eseguita a livello dell'apertura delle vie aeree del paziente con un sensore mainstream di CO2 CAPNOSTAT® 5. I ventilatori Hamilton Medical offrono inoltre una panoramica di tutti i valori rilevanti legati alla CO2 nella finestra di monitoraggio della CO2.

E-book sulla capnografia volumetrica

E-book gratuito

Buono a sapersi! Tutto sulla capnografia volumetrica

Tutto quel che serve per interpretare un capnogramma volumetrico e avere una panoramica dei vantaggi e delle applicazioni cliniche della capnografia volumetrica. Comprende un test da eseguire in autonomia!

Note

  • A. Tutti i modelli eccetto l'HAMILTON-MR1

Bibliografia

  1. 1. Kremeier P, Böhm SH, Tusman G. Clinical use of volumetric capnography in mechanically ventilated patients. J Clin Monit Comput. 2020;34(1):7-16. doi:10.1007/s10877-019-00325-9
  2. 2. Gravenstein, J., Jaffe, M., & Paulus, D. (2004). Capnography: Clinical Aspects. New York: Cambridge University Press.
  3. 3. I-Gnaidy E., Abo El-Nasr, L., Ameen, S., & Abd El-Ghafar, M. (2019). Correlation between Cardon Dioxide Production and Mean Arterial Blood Pressure in Fluid Response in Mechanically Ventilated Patients. Medical Journal of Cairo University, 87(4), 2679-2684.
  4. 4. Kallet RH, Alonso JA, Pittet JF, Matthay MA. Prognostic value of the pulmonary dead-space fraction during the first 6 days of acute respiratory distress syndrome. Respir Care. 2004;49(9):1008-1014.
  5. 5. Nuckton TJ, Alonso JA, Kallet RH, et al. Pulmonary dead-space fraction as a risk factor for death in the acute respiratory distress syndrome. N Engl J Med. 2002;346(17):1281-1286. doi:10.1056/NEJMoa012835
  6. 6. Blankman P, Shono A, Hermans BJ, Wesselius T, Hasan D, Gommers D. Detection of optimal PEEP for equal distribution of tidal volume by volumetric capnography and electrical impedance tomography during decreasing levels of PEEP in post cardiac-surgery patients. Br J Anaesth. 2016;116(6):862-869. doi:10.1093/bja/aew116
  7. 7. Nguyen LS, Squara P. Non-Invasive Monitoring of Cardiac Output in Critical Care Medicine. Front Med (Lausanne). 2017;4:200. Published 2017 Nov 20. doi:10.3389/fmed.2017.00200
  8. 8. Stapel SN, de Grooth HJ, Alimohamad H, et al. Ventilator-derived carbon dioxide production to assess energy expenditure in critically ill patients: proof of concept. Crit Care. 2015;19:370. Published 2015 Oct 22. doi:10.1186/s13054-015-1087-2

Clinical use of volumetric capnography in mechanically ventilated patients.

Kremeier P, Böhm SH, Tusman G. Clinical use of volumetric capnography in mechanically ventilated patients. J Clin Monit Comput. 2020;34(1):7-16. doi:10.1007/s10877-019-00325-9

Capnography is a first line monitoring system in mechanically ventilated patients. Volumetric capnography supports noninvasive and breath-by-breath information at the bedside using mainstream CO2 and flow sensors placed at the airways opening. This volume-based capnography provides information of important body functions related to the kinetics of carbon dioxide. Volumetric capnography goes one step forward standard respiratory mechanics and provides a new dimension for monitoring of mechanical ventilation. The article discusses the role of volumetric capnography for the clinical monitoring of mechanical ventilation.

Capnography: Clinical Aspects

Gravenstein, J., Jaffe, M., & Paulus, D. (2004). Capnography: Clinical Aspects. New York: Cambridge University Press.

Correlation between Carbon Dioxide Production and Mean Arterial Blood Pressure in Fluid Response in Mechanically Ventilated Patients

I-Gnaidy E., Abo El-Nasr, L., Ameen, S., & Abd El-Ghafar, M. (2019). Correlation between Cardon Dioxide Production and Mean Arterial Blood Pressure in Fluid Response in Mechanically Ventilated Patients. Medical Journal of Cairo University, 87(4), 2679-2684.

Prognostic value of the pulmonary dead-space fraction during the first 6 days of acute respiratory distress syndrome.

Kallet RH, Alonso JA, Pittet JF, Matthay MA. Prognostic value of the pulmonary dead-space fraction during the first 6 days of acute respiratory distress syndrome. Respir Care. 2004;49(9):1008-1014.


BACKGROUND

The ratio of pulmonary dead space to tidal volume (VD/VT) in acute respiratory distress syndrome (ARDS) is reported to be between 0.35 and 0.55. However, VD/VT has seldom been measured with consideration to the evolving pathophysiology of ARDS.

METHODS

We made serial VD/VT measurements with 59 patients who required mechanical ventilation for > or = 6 days. We measured VD/VT within 24 h of the point at which the patient met the American-European Consensus Conference criteria for ARDS, and we repeated the VD/VT measurement on ARDS days 2, 3, and 6 with a bedside metabolic monitor during volume-regulated ventilation. We analyzed the changes in VD/VT over the 6-day period to determine whether VD/VT has a significant association with mortality.

RESULTS

VD/VT was significantly higher in nonsurvivors on day 1 (0.61 +/- 0.09 vs 0.54 +/- 0.08, p < 0.05), day 2 (0.63 +/- 0.09 vs 0.53 +/- 0.09, p < 0.001), day 3 (0.64 +/- 0.09 vs 0.53 +/- 0.09, p < 0.001), and day 6 (0.66 +/- 0.09 vs 0.51 +/- 0.08, p < 0.001).

CONCLUSION

In ARDS a sustained VD/VT elevation is characteristic of nonsurvivors, so dead-space measurements made beyond the first 24 hours may have prognostic value.

Pulmonary dead-space fraction as a risk factor for death in the acute respiratory distress syndrome.

Nuckton TJ, Alonso JA, Kallet RH, et al. Pulmonary dead-space fraction as a risk factor for death in the acute respiratory distress syndrome. N Engl J Med. 2002;346(17):1281-1286. doi:10.1056/NEJMoa012835


BACKGROUND

No single pulmonary-specific variable, including the severity of hypoxemia, has been found to predict the risk of death independently when measured early in the course of the acute respiratory distress syndrome. Because an increase in the pulmonary dead-space fraction has been described in observational studies of the syndrome, we systematically measured the dead-space fraction early in the course of the illness and evaluated its potential association with the risk of death.

METHODS

The dead-space fraction was prospectively measured in 179 intubated patients, a mean (+/-SD) of 10.9+/-7.4 hours after the acute respiratory distress syndrome had developed. Additional clinical and physiological variables were analyzed with the use of multiple logistic regression. The study outcome was mortality before hospital discharge.

RESULTS

The mean dead-space fraction was markedly elevated (0.58+/-0.09) early in the course of the acute respiratory distress syndrome and was higher among patients who died than among those who survived (0.63+/-0.10 vs. 0.54+/-0.09, P<0.001). The dead-space fraction was an independent risk factor for death: for every 0.05 increase, the odds of death increased by 45 percent (odds ratio, 1.45; 95 percent confidence interval, 1.15 to 1.83; P=0.002). The only other independent predictors of an increased risk of death were the Simplified Acute Physiology Score II, an indicator of the severity of illness (odds ratio, 1.06; 95 percent confidence interval, 1.03 to 1.08; P<0.001) and quasistatic respiratory compliance (odds ratio, 1.06; 95 percent confidence interval, 1.01 to 1.10; P=0.01).

CONCLUSIONS

Increased dead-space fraction is a feature of the early phase of the acute respiratory distress syndrome. Elevated values are associated with an increased risk of death.

Detection of optimal PEEP for equal distribution of tidal volume by volumetric capnography and electrical impedance tomography during decreasing levels of PEEP in post cardiac-surgery patients.

Blankman P, Shono A, Hermans BJ, Wesselius T, Hasan D, Gommers D. Detection of optimal PEEP for equal distribution of tidal volume by volumetric capnography and electrical impedance tomography during decreasing levels of PEEP in post cardiac-surgery patients. Br J Anaesth. 2016;116(6):862-869. doi:10.1093/bja/aew116


BACKGROUND

Homogeneous ventilation is important for prevention of ventilator-induced lung injury. Electrical impedance tomography (EIT) has been used to identify optimal PEEP by detection of homogenous ventilation in non-dependent and dependent lung regions. We aimed to compare the ability of volumetric capnography and EIT in detecting homogenous ventilation between these lung regions.

METHODS

Fifteen mechanically-ventilated patients after cardiac surgery were studied. Ventilator settings were adjusted to volume-controlled mode with a fixed tidal volume (Vt) of 6-8 ml kg(-1) predicted body weight. Different PEEP levels were applied (14 to 0 cm H2O, in steps of 2 cm H2O) and blood gases, Vcap and EIT were measured.

RESULTS

Tidal impedance variation of the non-dependent region was highest at 6 cm H2O PEEP, and decreased significantly at 14 cm H2O PEEP indicating decrease in the fraction of Vt in this region. At 12 cm H2O PEEP, homogenous ventilation was seen between both lung regions. Bohr and Enghoff dead space calculations decreased from a PEEP of 10 cm H2O. Alveolar dead space divided by alveolar Vt decreased at PEEP levels ≤6 cm H2O. The normalized slope of phase III significantly changed at PEEP levels ≤4 cm H2O. Airway dead space was higher at higher PEEP levels and decreased at the lower PEEP levels.

CONCLUSIONS

In postoperative cardiac patients, calculated dead space agreed well with EIT to detect the optimal PEEP for an equal distribution of inspired volume, amongst non-dependent and dependent lung regions. Airway dead space reduces at decreasing PEEP levels.

Non-Invasive Monitoring of Cardiac Output in Critical Care Medicine.

Nguyen LS, Squara P. Non-Invasive Monitoring of Cardiac Output in Critical Care Medicine. Front Med (Lausanne). 2017;4:200. Published 2017 Nov 20. doi:10.3389/fmed.2017.00200

Critically ill patients require close hemodynamic monitoring to titrate treatment on a regular basis. It allows administering fluid with parsimony and adjusting inotropes and vasoactive drugs when necessary. Although invasive monitoring is considered as the reference method, non-invasive monitoring presents the obvious advantage of being associated with fewer complications, at the expanse of accuracy, precision, and step-response change. A great many methods and devices are now used over the world, and this article focuses on several of them, providing with a brief review of related underlying physical principles and validation articles analysis. Reviewed methods include electrical bioimpedance and bioreactance, respiratory-derived cardiac output (CO) monitoring technique, pulse wave transit time, ultrasound CO monitoring, multimodal algorithmic estimation, and inductance thoracocardiography. Quality criteria with which devices were reviewed included: accuracy (closeness of agreement between a measurement value and a true value of the measured), precision (closeness of agreement between replicate measurements on the same or similar objects under specified conditions), and step response change (delay between physiological change and its indication). Our conclusion is that the offer of non-invasive monitoring has improved in the past few years, even though further developments are needed to provide clinicians with sufficiently accurate devices for routine use, as alternative to invasive monitoring devices.

Ventilator-derived carbon dioxide production to assess energy expenditure in critically ill patients: proof of concept.

Stapel SN, de Grooth HJ, Alimohamad H, et al. Ventilator-derived carbon dioxide production to assess energy expenditure in critically ill patients: proof of concept. Crit Care. 2015;19:370. Published 2015 Oct 22. doi:10.1186/s13054-015-1087-2


INTRODUCTION

Measurement of energy expenditure (EE) is recommended to guide nutrition in critically ill patients. Availability of a gold standard indirect calorimetry is limited, and continuous measurement is unfeasible. Equations used to predict EE are inaccurate. The purpose of this study was to provide proof of concept that EE can be accurately assessed on the basis of ventilator-derived carbon dioxide production (VCO2) and to determine whether this method is more accurate than frequently used predictive equations.

METHODS

In 84 mechanically ventilated critically ill patients, we performed 24-h indirect calorimetry to obtain a gold standard EE. Simultaneously, we collected 24-h ventilator-derived VCO2, extracted the respiratory quotient of the administered nutrition, and calculated EE with a rewritten Weir formula. Bias, precision, and accuracy and inaccuracy rates were determined and compared with four predictive equations: the Harris-Benedict, Faisy, and Penn State University equations and the European Society for Clinical Nutrition and Metabolism (ESPEN) guideline equation of 25 kcal/kg/day.

RESULTS

Mean 24-h indirect calorimetry EE was 1823 ± 408 kcal. EE from ventilator-derived VCO2 was accurate (bias +141 ± 153 kcal/24 h; 7.7 % of gold standard) and more precise than the predictive equations (limits of agreement -166 to +447 kcal/24 h). The 10 % and 15 % accuracy rates were 61 % and 76 %, respectively, which were significantly higher than those of the Harris-Benedict, Faisy, and ESPEN guideline equations. Large errors of more than 30 % inaccuracy did not occur with EE derived from ventilator-derived VCO2. This 30 % inaccuracy rate was significantly lower than that of the predictive equations.

CONCLUSIONS

In critically ill mechanically ventilated patients, assessment of EE based on ventilator-derived VCO2 is accurate and more precise than frequently used predictive equations. It allows for continuous monitoring and is the best alternative to indirect calorimetry.

Related articles. Get a deeper look