Назад

Базовая капнография как инструмент непрерывного мониторинга во время искусственной вентиляции легких

Статья

Автор: Джо Хилтон, врач-консультант, бакалавр наук в области радиологических технологий, аккредитованный специалист по дыхательной терапии у взрослых/педиатрических/неонатальных пациентов, участник программы неонатальной реанимации, член Американской ассоциации искусственной вентиляции легких, член Американской коллегии интенсивной терапии, специалист по клиническим процедурам, компания Hamilton Medical Inc.

Дата: 15.07.2021

Капнография давно известна в области интенсивной терапии и неотложной медицинской помощи. Она широко используется как инструмент контроля уровня кислорода в дыхательных путях и применяется в условиях обезболивания при сохранении сознания, а также во время транспортировки интубированных пациентов, нуждающихся в искусственной вентиляции легких, между больницами.  С помощью капнографии хорошо обученный медицинский персонал может получать своевременную и ценную информацию.

Базовая капнография как инструмент непрерывного мониторинга во время искусственной вентиляции легких

Физиологические факторы, влияющие на концентрацию углекислого газа в конце выдоха (PetCO2)

Существует множество факторов, которые могут повлиять на количество углекислого газа в выдыхаемой газовой смеси (PetCO2). Для выведения СО2 существует тесный, непрерывный баланс между выработкой СО2 в тканях, его транспортировкой в крови, диффузией в альвеолы и выведением путем вентиляции (Kremeier P, Böhm SH, Tusman G. Clinical use of volumetric capnography in mechanically ventilated patients. J Clin Monit Comput. 2020;34(1):7-16. doi:10.1007/s10877-019-00325-91​). Капнография обеспечивает графическое представление выдыхаемого CO2 и служит неинвазивным средством отображения информации в реальном времени о динамике CO2 у пациентов на искусственной вентиляции легких.

Повышение или снижение скорости метаболизма пациента приводит к изменениям в выработке CO2, а следовательно, и в выведении CO2. Если и кровообращение, и вентиляция стабильны – состояние, которого можно достичь только у пациентов, находящихся на пассивной искусственной вентиляции легких, –  мониторинг CO2 можно использовать в качестве индикатора выработки CO2. Лихорадка, сепсис, боль и судороги – все это состояния, которые ускоряют метаболизм и вызывают соответствующее увеличение выработки CO2 и, в свою очередь, увеличение PetCO2. Снижение скорости метаболизма наблюдается у пациентов, находящихся в состоянии гипотермии, под наркозом или пораженных параличом. В таких состояниях выработка CO2 снижается, что может привести к снижению PetCO2, если одновременно не увеличить минутную вентиляцию (Gravenstein, J., Jaffe, M., & Paulus, D. (2004). Capnography: Clinical Aspects. New York: Cambridge University Press.2​).

Поступление CO2 в легкие зависит от правильности функционирования сердечно-сосудистой системы; следовательно, любой фактор, который влияет на функции сердечно-сосудистой системы, также может влиять на поступление CO2 в легкие.(Gravenstein, J., Jaffe, M., & Paulus, D. (2004). Capnography: Clinical Aspects. New York: Cambridge University Press.2​).

На выведение CO2 из легких в окружающую среду влияют изменения в дыхательной функции. Таким образом, обструктивные заболевания легких, пневмония, нервно-мышечные нарушения и заболевания центральной нервной системы, приводящие к нарушению дыхательной функции, влияют на изменение значения PetCO2 (Gravenstein, J., Jaffe, M., & Paulus, D. (2004). Capnography: Clinical Aspects. New York: Cambridge University Press.2​).

Типы капнографии

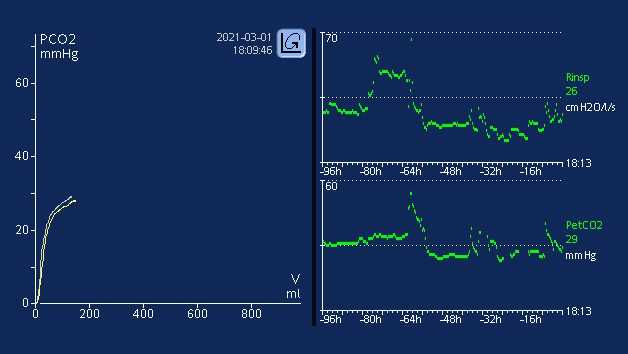
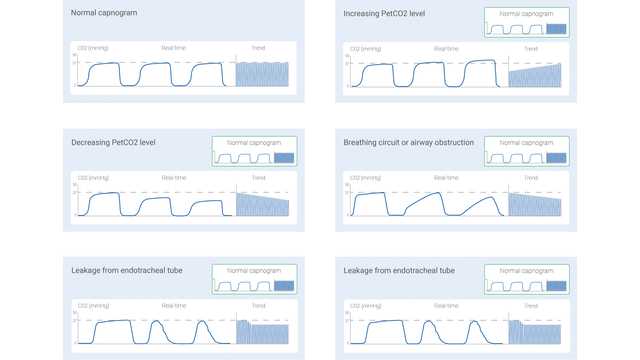
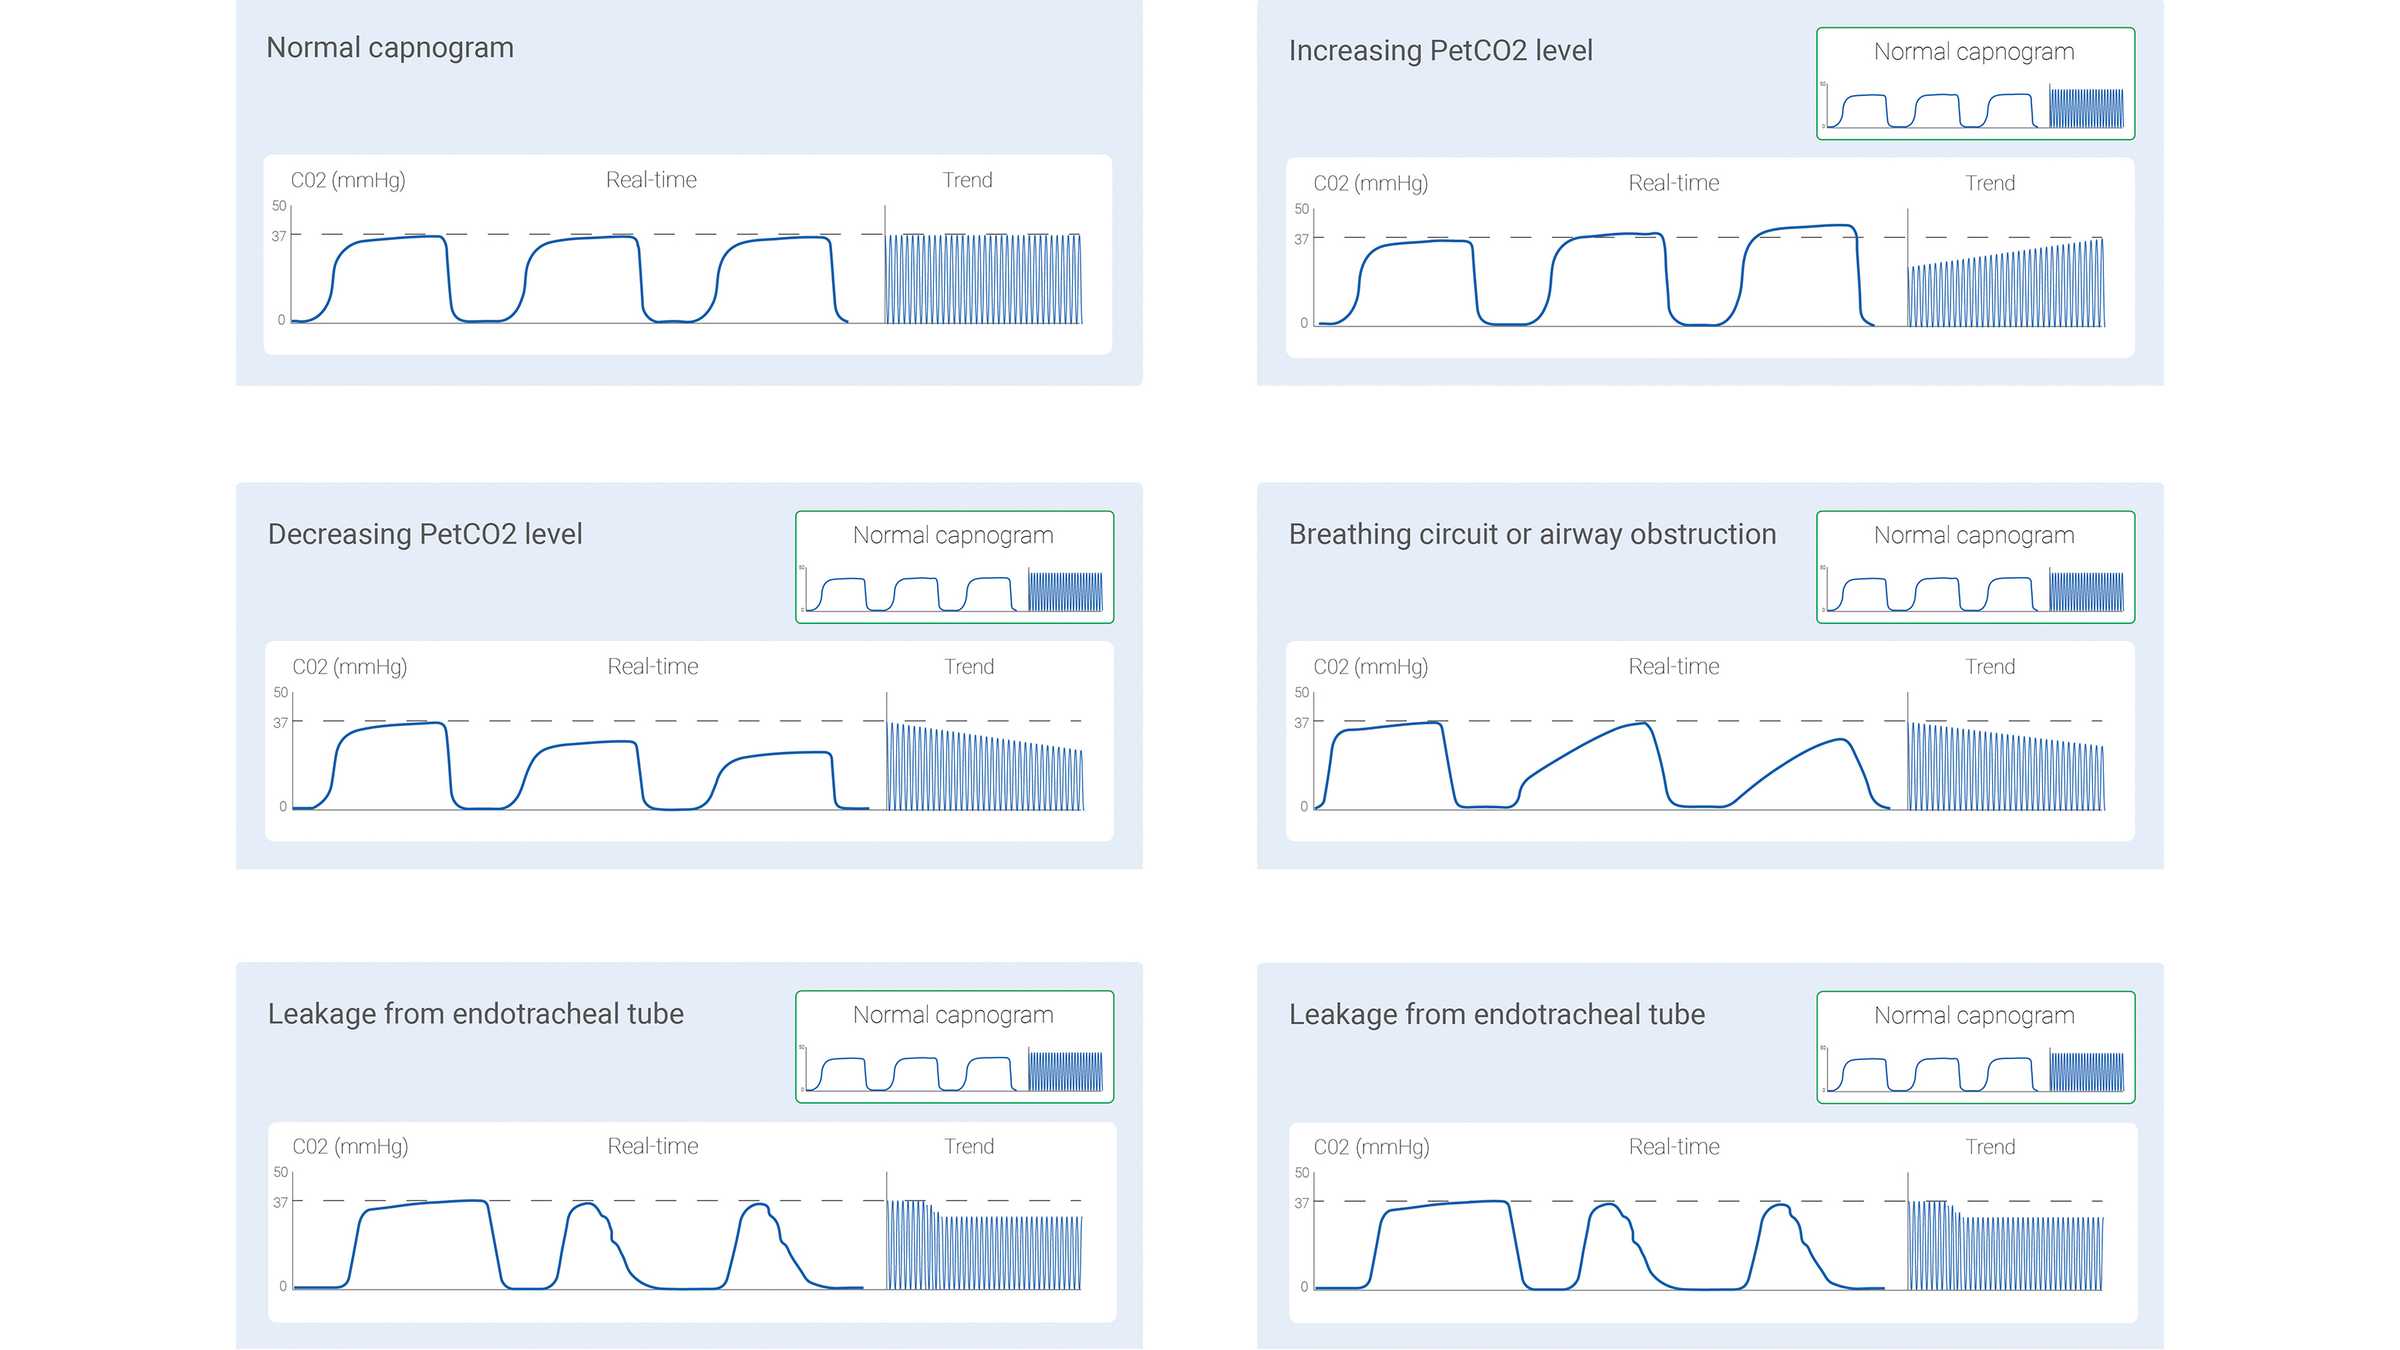
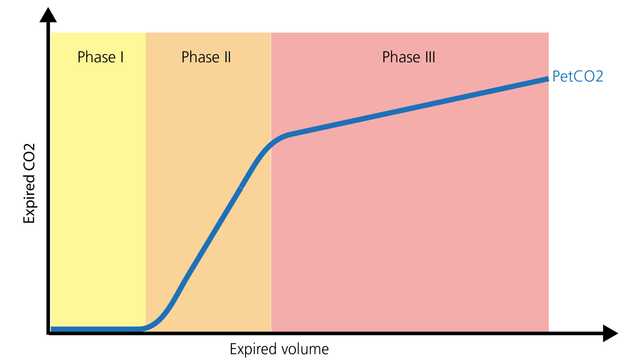
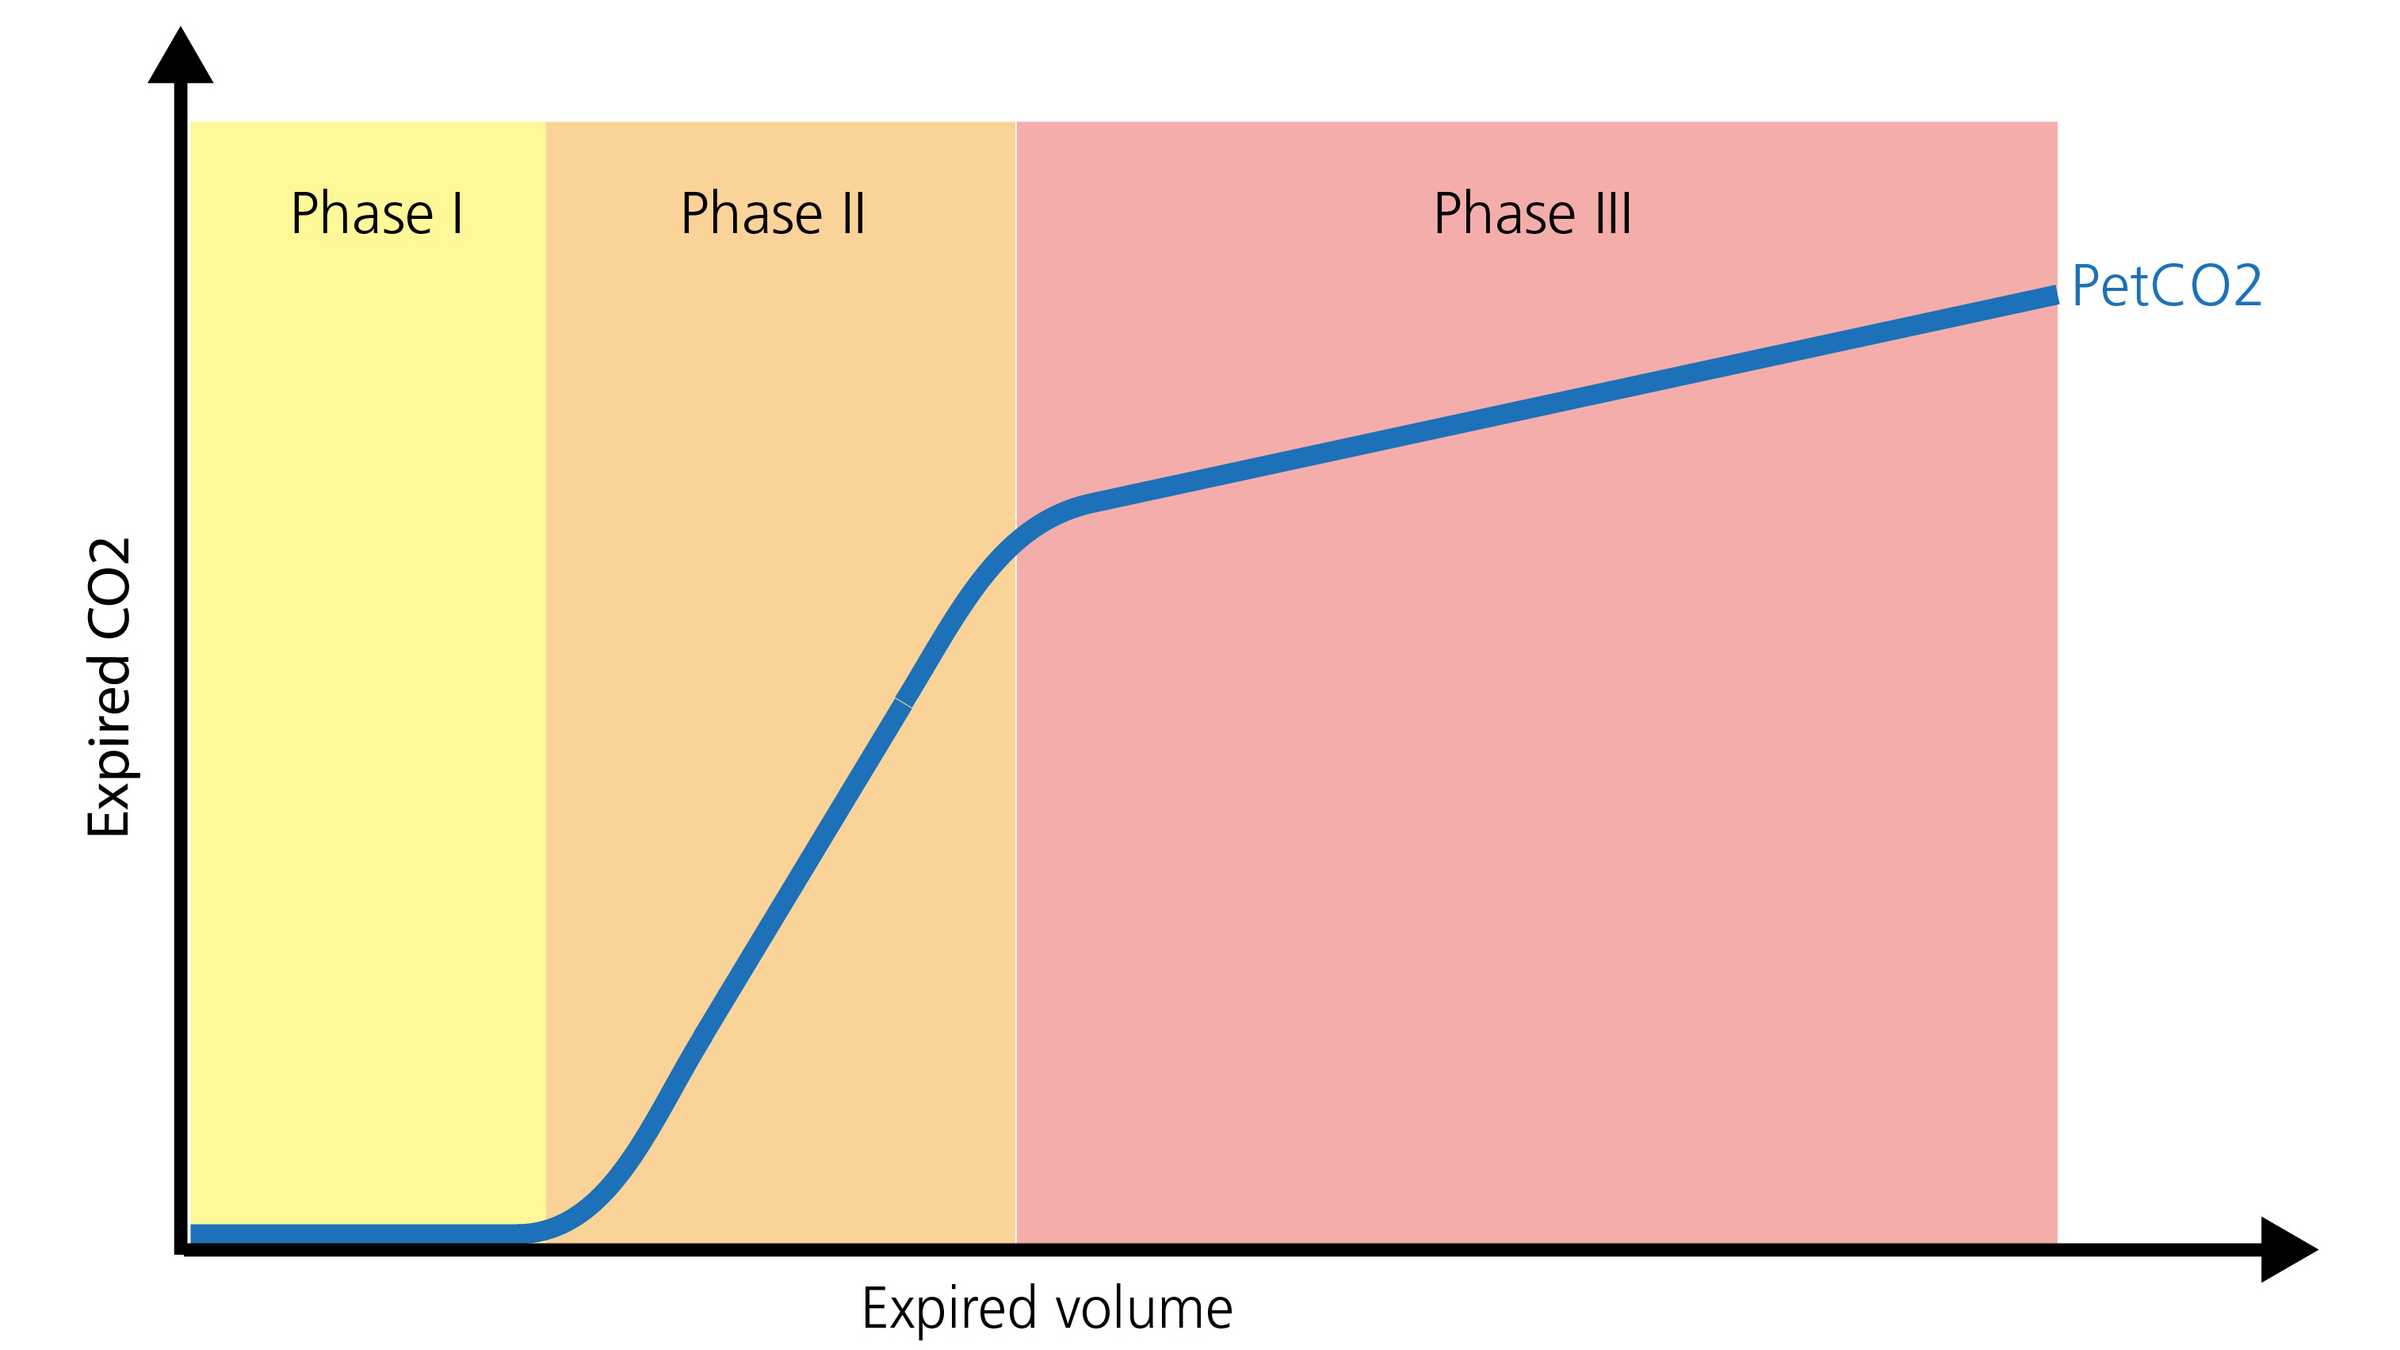
Измеренный сигнал датчика CO2 может быть записан либо как функция времени (капнография, контролируемая по времени), либо как функция выдыхаемого объема (волюметрическая капнография). Объем информации, которую можно получить при использовании этих двух разных типов капнографии, значительно отличается. В литературе описаны определенные закономерности капнограммы, контролируемой по времени, которые считаются типичными для конкретных клинических ситуаций. Некоторые из общих закономерностей показаны на рисунке 1 ниже.

Однако капнография, контролируемая по времени, также имеет ограничения. Он не может обеспечить точную оценку состояния вентиляции и перфузии легких, а также не может использоваться для оценки компонента физиологического мертвого пространства. Волюметрическая капнография не так проста и удобна, как капнография, контролируемая по времени, однако ее преимущество заключается в значительно большем объеме информации.

Диаграммы, на которых представлены капнограммы для часто встречающихся состояний
Рисунок 1
Диаграммы, на которых представлены капнограммы для часто встречающихся состояний
Рисунок 1

Форма и фазы волюметрической капнограммы

Нормальная форма волюметрической капнограммы состоит из трех фаз. Важно помнить, что капнограмма отражает выдох.

  • Фаза I представляет собой газовую смесь без CO2 из дыхательных путей (анатомическое и инструментальное мертвое пространство).
  • Фаза II – это переходная фаза, в которой газовая смесь из дыхательных путей смешивается с альвеолярным газом.
  • Фаза III представляет собой фазу плато, состоящую из газа из альвеол и медленно опорожняющихся участков легких (Gravenstein, J., Jaffe, M., & Paulus, D. (2004). Capnography: Clinical Aspects. New York: Cambridge University Press.2​). Визуальное представление показано ниже на рисунке 2.
Диаграмма, на которой представлены три фазы
Рисунок 2
Диаграмма, на которой представлены три фазы
Рисунок 2

Капнография во время транспортировки

С помощью капнографии, как контролируемой по времени, так и волюметрической, можно получить ценную информацию для оптимизации мониторинга и лечения пациентов, которым требуется транспортировка в пределах больницы или в другие больницы. Ее можно безопасно использовать с эндотрахеальными трубками, трахеостомическими трубками и многими надгортанными воздуховодами при наличии необходимого уплотнения. Расположение и проходимость дыхательных путей, мониторинг вентиляции и состояние перфузии – все это области, в которых PetCO2 предоставляет важную информацию. Еще одним значимым параметром является объем углекислого газа, выводимого за минуту (V’CO2), который позволяет медицинскому персоналу оценивать эффективность перфузии и реанимационных мероприятий (I-Gnaidy E., Abo El-Nasr, L., Ameen, S., & Abd El-Ghafar, M. (2019). Correlation between Cardon Dioxide Production and Mean Arterial Blood Pressure in Fluid Response in Mechanically Ventilated Patients. Medical Journal of Cairo University, 87(4), 2679-2684.3​).

Капнография отделении интенсивной терапии

У пациентов отделения интенсивной терапии капнография может продолжать мониторинг расположения и проходимости дыхательных путей с использованием различных дополнительных средств. Соотношение мертвого пространства и дыхательного объема (VD/Vt) является важным показателем капнографии.  Увеличение соотношения VD/Vt может означать потенциальное увеличение смертности в зависимости от уровня увеличения (Kallet RH, Alonso JA, Pittet JF, Matthay MA. Prognostic value of the pulmonary dead-space fraction during the first 6 days of acute respiratory distress syndrome. Respir Care. 2004;49(9):1008-1014. 4​, Nuckton TJ, Alonso JA, Kallet RH, et al. Pulmonary dead-space fraction as a risk factor for death in the acute respiratory distress syndrome. N Engl J Med. 2002;346(17):1281-1286. doi:10.1056/NEJMoa0128355​). Медицинский персонал может использовать кривую PetCO2 и значение «V’CO2» для оптимизации раскрытия объема легких, подтверждения оптимальности настроек PEEP и выявления проблем с перфузией (общей и легочной).(Kallet RH, Alonso JA, Pittet JF, Matthay MA. Prognostic value of the pulmonary dead-space fraction during the first 6 days of acute respiratory distress syndrome. Respir Care. 2004;49(9):1008-1014. 4​, Nuckton TJ, Alonso JA, Kallet RH, et al. Pulmonary dead-space fraction as a risk factor for death in the acute respiratory distress syndrome. N Engl J Med. 2002;346(17):1281-1286. doi:10.1056/NEJMoa0128355​, Blankman P, Shono A, Hermans BJ, Wesselius T, Hasan D, Gommers D. Detection of optimal PEEP for equal distribution of tidal volume by volumetric capnography and electrical impedance tomography during decreasing levels of PEEP in post cardiac-surgery patients. Br J Anaesth. 2016;116(6):862-869. doi:10.1093/bja/aew1166​, Nguyen LS, Squara P. Non-Invasive Monitoring of Cardiac Output in Critical Care Medicine. Front Med (Lausanne). 2017;4:200. Published 2017 Nov 20. doi:10.3389/fmed.2017.002007​). Параметр V’CO2 также можно использовать во время искусственной вентиляции легких. С его помощью медицинский персонал может выявлять потенциальную слабость или дыхательную недостаточность пациента (увеличение доли мертвого пространства, недостаточное усилие и утомление дыхательных мышц). Определение расхода энергии с помощью значения V’CO2 – это правильный и точный метод, который медицинский персонал может использовать для расчета потребности в питании пациентов на искусственной вентиляции легких (Stapel SN, de Grooth HJ, Alimohamad H, et al. Ventilator-derived carbon dioxide production to assess energy expenditure in critically ill patients: proof of concept. Crit Care. 2015;19:370. Published 2015 Oct 22. doi:10.1186/s13054-015-1087-28​).

Во всех аппаратах ИВЛ Hamilton Medical доступна волюметрическая капнография (Все модели, кроме аппарата ИВЛ HAMILTON-MR1A​) в качестве стандартной или дополнительной функции. Измерение CO2 выполняется с помощью датчика основного потока CO2 CAPNOSTAT® 5 при открытии дыхательных путей пациента. Кроме того, в этих аппаратах ИВЛ все значения, связанные с CO2, отображаются в окне «Мониторинг CO2».

Электронная книга о волюметрической капнографии

Бесплатная электронная книга

Полезно знать! Все о волюметрической капнографии

Узнайте, как читать волюметрические капнограммы, каковы их преимущества и где применять полученные данные. Книга также содержит тест для самопроверки.

Сноски

  • A. Все модели, кроме HAMILTON-MR1

Список литературы

  1. 1. Kremeier P, Böhm SH, Tusman G. Clinical use of volumetric capnography in mechanically ventilated patients. J Clin Monit Comput. 2020;34(1):7-16. doi:10.1007/s10877-019-00325-9
  2. 2. Gravenstein, J., Jaffe, M., & Paulus, D. (2004). Capnography: Clinical Aspects. New York: Cambridge University Press.
  3. 3. I-Gnaidy E., Abo El-Nasr, L., Ameen, S., & Abd El-Ghafar, M. (2019). Correlation between Cardon Dioxide Production and Mean Arterial Blood Pressure in Fluid Response in Mechanically Ventilated Patients. Medical Journal of Cairo University, 87(4), 2679-2684.
  4. 4. Kallet RH, Alonso JA, Pittet JF, Matthay MA. Prognostic value of the pulmonary dead-space fraction during the first 6 days of acute respiratory distress syndrome. Respir Care. 2004;49(9):1008-1014.
  5. 5. Nuckton TJ, Alonso JA, Kallet RH, et al. Pulmonary dead-space fraction as a risk factor for death in the acute respiratory distress syndrome. N Engl J Med. 2002;346(17):1281-1286. doi:10.1056/NEJMoa012835
  6. 6. Blankman P, Shono A, Hermans BJ, Wesselius T, Hasan D, Gommers D. Detection of optimal PEEP for equal distribution of tidal volume by volumetric capnography and electrical impedance tomography during decreasing levels of PEEP in post cardiac-surgery patients. Br J Anaesth. 2016;116(6):862-869. doi:10.1093/bja/aew116
  7. 7. Nguyen LS, Squara P. Non-Invasive Monitoring of Cardiac Output in Critical Care Medicine. Front Med (Lausanne). 2017;4:200. Published 2017 Nov 20. doi:10.3389/fmed.2017.00200
  8. 8. Stapel SN, de Grooth HJ, Alimohamad H, et al. Ventilator-derived carbon dioxide production to assess energy expenditure in critically ill patients: proof of concept. Crit Care. 2015;19:370. Published 2015 Oct 22. doi:10.1186/s13054-015-1087-2

Clinical use of volumetric capnography in mechanically ventilated patients.

Kremeier P, Böhm SH, Tusman G. Clinical use of volumetric capnography in mechanically ventilated patients. J Clin Monit Comput. 2020;34(1):7-16. doi:10.1007/s10877-019-00325-9

Capnography is a first line monitoring system in mechanically ventilated patients. Volumetric capnography supports noninvasive and breath-by-breath information at the bedside using mainstream CO2 and flow sensors placed at the airways opening. This volume-based capnography provides information of important body functions related to the kinetics of carbon dioxide. Volumetric capnography goes one step forward standard respiratory mechanics and provides a new dimension for monitoring of mechanical ventilation. The article discusses the role of volumetric capnography for the clinical monitoring of mechanical ventilation.

Capnography: Clinical Aspects

Gravenstein, J., Jaffe, M., & Paulus, D. (2004). Capnography: Clinical Aspects. New York: Cambridge University Press.

Correlation between Carbon Dioxide Production and Mean Arterial Blood Pressure in Fluid Response in Mechanically Ventilated Patients

I-Gnaidy E., Abo El-Nasr, L., Ameen, S., & Abd El-Ghafar, M. (2019). Correlation between Cardon Dioxide Production and Mean Arterial Blood Pressure in Fluid Response in Mechanically Ventilated Patients. Medical Journal of Cairo University, 87(4), 2679-2684.

Prognostic value of the pulmonary dead-space fraction during the first 6 days of acute respiratory distress syndrome.

Kallet RH, Alonso JA, Pittet JF, Matthay MA. Prognostic value of the pulmonary dead-space fraction during the first 6 days of acute respiratory distress syndrome. Respir Care. 2004;49(9):1008-1014.


BACKGROUND

The ratio of pulmonary dead space to tidal volume (VD/VT) in acute respiratory distress syndrome (ARDS) is reported to be between 0.35 and 0.55. However, VD/VT has seldom been measured with consideration to the evolving pathophysiology of ARDS.

METHODS

We made serial VD/VT measurements with 59 patients who required mechanical ventilation for > or = 6 days. We measured VD/VT within 24 h of the point at which the patient met the American-European Consensus Conference criteria for ARDS, and we repeated the VD/VT measurement on ARDS days 2, 3, and 6 with a bedside metabolic monitor during volume-regulated ventilation. We analyzed the changes in VD/VT over the 6-day period to determine whether VD/VT has a significant association with mortality.

RESULTS

VD/VT was significantly higher in nonsurvivors on day 1 (0.61 +/- 0.09 vs 0.54 +/- 0.08, p < 0.05), day 2 (0.63 +/- 0.09 vs 0.53 +/- 0.09, p < 0.001), day 3 (0.64 +/- 0.09 vs 0.53 +/- 0.09, p < 0.001), and day 6 (0.66 +/- 0.09 vs 0.51 +/- 0.08, p < 0.001).

CONCLUSION

In ARDS a sustained VD/VT elevation is characteristic of nonsurvivors, so dead-space measurements made beyond the first 24 hours may have prognostic value.

Pulmonary dead-space fraction as a risk factor for death in the acute respiratory distress syndrome.

Nuckton TJ, Alonso JA, Kallet RH, et al. Pulmonary dead-space fraction as a risk factor for death in the acute respiratory distress syndrome. N Engl J Med. 2002;346(17):1281-1286. doi:10.1056/NEJMoa012835


BACKGROUND

No single pulmonary-specific variable, including the severity of hypoxemia, has been found to predict the risk of death independently when measured early in the course of the acute respiratory distress syndrome. Because an increase in the pulmonary dead-space fraction has been described in observational studies of the syndrome, we systematically measured the dead-space fraction early in the course of the illness and evaluated its potential association with the risk of death.

METHODS

The dead-space fraction was prospectively measured in 179 intubated patients, a mean (+/-SD) of 10.9+/-7.4 hours after the acute respiratory distress syndrome had developed. Additional clinical and physiological variables were analyzed with the use of multiple logistic regression. The study outcome was mortality before hospital discharge.

RESULTS

The mean dead-space fraction was markedly elevated (0.58+/-0.09) early in the course of the acute respiratory distress syndrome and was higher among patients who died than among those who survived (0.63+/-0.10 vs. 0.54+/-0.09, P<0.001). The dead-space fraction was an independent risk factor for death: for every 0.05 increase, the odds of death increased by 45 percent (odds ratio, 1.45; 95 percent confidence interval, 1.15 to 1.83; P=0.002). The only other independent predictors of an increased risk of death were the Simplified Acute Physiology Score II, an indicator of the severity of illness (odds ratio, 1.06; 95 percent confidence interval, 1.03 to 1.08; P<0.001) and quasistatic respiratory compliance (odds ratio, 1.06; 95 percent confidence interval, 1.01 to 1.10; P=0.01).

CONCLUSIONS

Increased dead-space fraction is a feature of the early phase of the acute respiratory distress syndrome. Elevated values are associated with an increased risk of death.

Detection of optimal PEEP for equal distribution of tidal volume by volumetric capnography and electrical impedance tomography during decreasing levels of PEEP in post cardiac-surgery patients.

Blankman P, Shono A, Hermans BJ, Wesselius T, Hasan D, Gommers D. Detection of optimal PEEP for equal distribution of tidal volume by volumetric capnography and electrical impedance tomography during decreasing levels of PEEP in post cardiac-surgery patients. Br J Anaesth. 2016;116(6):862-869. doi:10.1093/bja/aew116


BACKGROUND

Homogeneous ventilation is important for prevention of ventilator-induced lung injury. Electrical impedance tomography (EIT) has been used to identify optimal PEEP by detection of homogenous ventilation in non-dependent and dependent lung regions. We aimed to compare the ability of volumetric capnography and EIT in detecting homogenous ventilation between these lung regions.

METHODS

Fifteen mechanically-ventilated patients after cardiac surgery were studied. Ventilator settings were adjusted to volume-controlled mode with a fixed tidal volume (Vt) of 6-8 ml kg(-1) predicted body weight. Different PEEP levels were applied (14 to 0 cm H2O, in steps of 2 cm H2O) and blood gases, Vcap and EIT were measured.

RESULTS

Tidal impedance variation of the non-dependent region was highest at 6 cm H2O PEEP, and decreased significantly at 14 cm H2O PEEP indicating decrease in the fraction of Vt in this region. At 12 cm H2O PEEP, homogenous ventilation was seen between both lung regions. Bohr and Enghoff dead space calculations decreased from a PEEP of 10 cm H2O. Alveolar dead space divided by alveolar Vt decreased at PEEP levels ≤6 cm H2O. The normalized slope of phase III significantly changed at PEEP levels ≤4 cm H2O. Airway dead space was higher at higher PEEP levels and decreased at the lower PEEP levels.

CONCLUSIONS

In postoperative cardiac patients, calculated dead space agreed well with EIT to detect the optimal PEEP for an equal distribution of inspired volume, amongst non-dependent and dependent lung regions. Airway dead space reduces at decreasing PEEP levels.

Non-Invasive Monitoring of Cardiac Output in Critical Care Medicine.

Nguyen LS, Squara P. Non-Invasive Monitoring of Cardiac Output in Critical Care Medicine. Front Med (Lausanne). 2017;4:200. Published 2017 Nov 20. doi:10.3389/fmed.2017.00200

Critically ill patients require close hemodynamic monitoring to titrate treatment on a regular basis. It allows administering fluid with parsimony and adjusting inotropes and vasoactive drugs when necessary. Although invasive monitoring is considered as the reference method, non-invasive monitoring presents the obvious advantage of being associated with fewer complications, at the expanse of accuracy, precision, and step-response change. A great many methods and devices are now used over the world, and this article focuses on several of them, providing with a brief review of related underlying physical principles and validation articles analysis. Reviewed methods include electrical bioimpedance and bioreactance, respiratory-derived cardiac output (CO) monitoring technique, pulse wave transit time, ultrasound CO monitoring, multimodal algorithmic estimation, and inductance thoracocardiography. Quality criteria with which devices were reviewed included: accuracy (closeness of agreement between a measurement value and a true value of the measured), precision (closeness of agreement between replicate measurements on the same or similar objects under specified conditions), and step response change (delay between physiological change and its indication). Our conclusion is that the offer of non-invasive monitoring has improved in the past few years, even though further developments are needed to provide clinicians with sufficiently accurate devices for routine use, as alternative to invasive monitoring devices.

Ventilator-derived carbon dioxide production to assess energy expenditure in critically ill patients: proof of concept.

Stapel SN, de Grooth HJ, Alimohamad H, et al. Ventilator-derived carbon dioxide production to assess energy expenditure in critically ill patients: proof of concept. Crit Care. 2015;19:370. Published 2015 Oct 22. doi:10.1186/s13054-015-1087-2


INTRODUCTION

Measurement of energy expenditure (EE) is recommended to guide nutrition in critically ill patients. Availability of a gold standard indirect calorimetry is limited, and continuous measurement is unfeasible. Equations used to predict EE are inaccurate. The purpose of this study was to provide proof of concept that EE can be accurately assessed on the basis of ventilator-derived carbon dioxide production (VCO2) and to determine whether this method is more accurate than frequently used predictive equations.

METHODS

In 84 mechanically ventilated critically ill patients, we performed 24-h indirect calorimetry to obtain a gold standard EE. Simultaneously, we collected 24-h ventilator-derived VCO2, extracted the respiratory quotient of the administered nutrition, and calculated EE with a rewritten Weir formula. Bias, precision, and accuracy and inaccuracy rates were determined and compared with four predictive equations: the Harris-Benedict, Faisy, and Penn State University equations and the European Society for Clinical Nutrition and Metabolism (ESPEN) guideline equation of 25 kcal/kg/day.

RESULTS

Mean 24-h indirect calorimetry EE was 1823 ± 408 kcal. EE from ventilator-derived VCO2 was accurate (bias +141 ± 153 kcal/24 h; 7.7 % of gold standard) and more precise than the predictive equations (limits of agreement -166 to +447 kcal/24 h). The 10 % and 15 % accuracy rates were 61 % and 76 %, respectively, which were significantly higher than those of the Harris-Benedict, Faisy, and ESPEN guideline equations. Large errors of more than 30 % inaccuracy did not occur with EE derived from ventilator-derived VCO2. This 30 % inaccuracy rate was significantly lower than that of the predictive equations.

CONCLUSIONS

In critically ill mechanically ventilated patients, assessment of EE based on ventilator-derived VCO2 is accurate and more precise than frequently used predictive equations. It allows for continuous monitoring and is the best alternative to indirect calorimetry.

Related articles. Get a deeper look