Back

Mitigating lung damage using rapid estimation of mechanical power

Article

Author: Justin Seemueller, Respiratory Clinical Specialist, Sentara Norfolk General Hospital

Date of first publication: 24.02.2021

It is currently understood that VILI is a consequence of stress and strain placed upon lung tissue during mechanical ventilation [1]. The severity of stress and strain induced is commonly estimated by monitoring airway pressure and tidal volumes the patient is receiving.
Mitigating lung damage using rapid estimation of mechanical power

Takeaway messages

  • Cumulative damage caused to the lung during mechanical ventilation can be expressed through mechanical power (total energy delivered in Joules per minute).
  • High mechanical power has been associated with increased mortality, even where sample groups received low tidal volumes or low driving pressures.
  • Simplified methods have been suggested for estimating mechanical power at the bedside.
  • Further automation of these calculations through electronic medical record systems may allow for earlier interventions with the aim of improving outcomes.


A combination of several variables

It is a generally accepted practice to limit tidal volume (per IBW), plateau pressure, and driving pressure (Plat-PEEP) within acceptable ranges for lung-protective ventilation (Amato MB, Meade MO, Slutsky AS, et al. Driving pressure and survival in the acute respiratory distress syndrome. N Engl J Med. 2015;372(8):747-755. doi:10.1056/NEJMsa14106392​). It should also be intuitive that respiratory rate is a hypothetical multiplier of the damage induced by positive pressure ventilation (Hotchkiss JR Jr, Blanch L, Murias G, et al. Effects of decreased respiratory frequency on ventilator-induced lung injury. Am J Respir Crit Care Med. 2000;161(2 Pt 1):463-468. doi:10.1164/ajrccm.161.2.98110083​). In addition, higher flow rates could also influence strain on the lung (Tonetti T, Vasques F, Rapetti F, et al. Driving pressure and mechanical power: new targets for VILI prevention. Ann Transl Med. 2017;5(14):286. doi:10.21037/atm.2017.07.084​). The cumulative lung damage caused by all known variables can ultimately be expressed through mechanical power, or total energy delivered in Joules per minute. High mechanical power has been associated with increased mortality in sample groups despite receiving low tidal volume strategies; this theme has also held true in cohorts of patients receiving low driving pressure, suggesting mechanical power serves as an independent metric worth tracking (Serpa Neto A, Deliberato RO, Johnson AEW, et al. Mechanical power of ventilation is associated with mortality in critically ill patients: an analysis of patients in two observational cohorts. Intensive Care Med. 2018;44(11):1914-1922. doi:10.1007/s00134-018-5375-65​).

A simplified method for estimating mechanical power

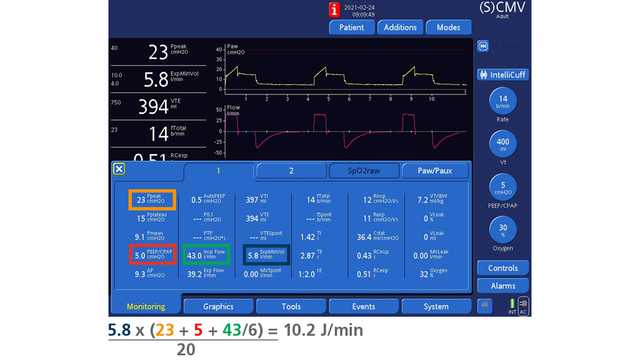
Gattinoni et al. have utilized derivative formulas to estimate mechanical power as a metric to mitigate lung damage. The most accurate bedside method is complicated and requires clinicians to perform an inspiratory hold to measure plateau pressure for accurate resistance and elastance values (Giosa L, Busana M, Pasticci I, et al. Mechanical power at a glance: a simple surrogate for volume-controlled ventilation. Intensive Care Med Exp. 2019;7(1):61. Published 2019 Nov 27. doi:10.1186/s40635-019-0276-81​). Depending on the level of sedation and patient effort, this may not always be possible.

Simplified methods have recently emerged to quickly estimate mechanical power without the need for an inspiratory hold maneuver. Gattinoni et al. proposed an acceptably accurate method for Volume Control ventilation; the simplified method was validated by comparing animal experimentation with a cohort of ICU patients from seven previously published studies (Cressoni M, Chiumello D, Chiurazzi C, et al. Lung inhomogeneities, inflation and [18F]2-fluoro-2-deoxy-D-glucose uptake rate in acute respiratory distress syndrome. Eur Respir J. 2016;47(1):233-242. doi:10.1183/13993003.00885-20156​, Gattinoni L, Caironi P, Cressoni M, et al. Lung recruitment in patients with the acute respiratory distress syndrome. N Engl J Med. 2006;354(17):1775-1786. doi:10.1056/NEJMoa0520527​, Cressoni M, Chiumello D, Algieri I, et al. Opening pressures and atelectrauma in acute respiratory distress syndrome. Intensive Care Med. 2017;43(5):603-611. doi:10.1007/s00134-017-4754-88​, Chiumello D, Cressoni M, Carlesso E, et al. Bedside selection of positive end-expiratory pressure in mild, moderate, and severe acute respiratory distress syndrome. Crit Care Med. 2014;42(2):252-264. doi:10.1097/CCM.0b013e3182a6384f9​, Chiumello D, Marino A, Brioni M, et al. Lung Recruitment Assessed by Respiratory Mechanics and Computed Tomography in Patients with Acute Respiratory Distress Syndrome. What Is the Relationship?. Am J Respir Crit Care Med. 2016;193(11):1254-1263. doi:10.1164/rccm.201507-1413OC10​, Chiumello D, Mongodi S, Algieri I, et al. Assessment of Lung Aeration and Recruitment by CT Scan and Ultrasound in Acute Respiratory Distress Syndrome Patients. Crit Care Med. 2018;46(11):1761-1768. doi:10.1097/CCM.000000000000334011​, Chiumello D, Marino A, Cressoni M, et al. Pleural effusion in patients with acute lung injury: a CT scan study. Crit Care Med. 2013;41(4):935-944. doi:10.1097/CCM.0b013e318275892c12​). At the cost of a small potential underestimation of actual mechanical power, the simplified method has advantages of simplicity and ease of tracking (Giosa L, Busana M, Pasticci I, et al. Mechanical power at a glance: a simple surrogate for volume-controlled ventilation. Intensive Care Med Exp. 2019;7(1):61. Published 2019 Nov 27. doi:10.1186/s40635-019-0276-81​). Becher et al. have also developed a simplified method of estimation when using Pressure Control ventilation by disregarding P-ramp, and they found a high degree of correlation to reference values of mechanical power (Becher T, van der Staay M, Schädler D, Frerichs I, Weiler N. Calculation of mechanical power for pressure-controlled ventilation. Intensive Care Med. 2019;45(9):1321-1323. doi:10.1007/s00134-019-05636-813​). Both of these surrogate methods have been shown to be accurate enough to justify their routine use within the clinical setting (Chiumello D, Gotti M, Guanziroli M, et al. Bedside calculation of mechanical power during volume- and pressure-controlled mechanical ventilation. Crit Care. 2020;24(1):417. Published 2020 Jul 11. doi:10.1186/s13054-020-03116-w14​).


Mechanical power and EMR systems

These new methodologies are interesting in the context of modern electronic medical record (EMR) systems, some of which can apply formulas to device integrated ventilator data. Epic is a fairly ubiquitous EMR system, and the company's system analysts have confirmed that it is possible to automatically calculate these types of shortened mechanical power formulas within new flowsheet rows. This presents an exciting prospect for generating instantaneous reports on all ventilator patients within a hospital system, who are currently receiving what might be considered unsafe levels of mechanical power. In two separate observational cohorts, a value of 17 J/min or greater was associated with a higher risk of death (Serpa Neto A, Deliberato RO, Johnson AEW, et al. Mechanical power of ventilation is associated with mortality in critically ill patients: an analysis of patients in two observational cohorts. Intensive Care Med. 2018;44(11):1914-1922. doi:10.1007/s00134-018-5375-65​). In the absence of the ventilator automatically displaying estimated mechanical power within current software, the clinician can calculate it at the bedside with relative ease. By further automating through the EMR, we may achieve earlier interventions with the aim of improving mortality outcomes.

Footnotes

References

  1. 1. Giosa L, Busana M, Pasticci I, et al. Mechanical power at a glance: a simple surrogate for volume-controlled ventilation. Intensive Care Med Exp. 2019;7(1):61. Published 2019 Nov 27. doi:10.1186/s40635-019-0276-8
  2. 2. Amato MB, Meade MO, Slutsky AS, et al. Driving pressure and survival in the acute respiratory distress syndrome. N Engl J Med. 2015;372(8):747-755. doi:10.1056/NEJMsa1410639
  3. 3. Hotchkiss JR Jr, Blanch L, Murias G, et al. Effects of decreased respiratory frequency on ventilator-induced lung injury. Am J Respir Crit Care Med. 2000;161(2 Pt 1):463-468. doi:10.1164/ajrccm.161.2.9811008
  4. 4. Tonetti T, Vasques F, Rapetti F, et al. Driving pressure and mechanical power: new targets for VILI prevention. Ann Transl Med. 2017;5(14):286. doi:10.21037/atm.2017.07.08
  5. 5. Serpa Neto A, Deliberato RO, Johnson AEW, et al. Mechanical power of ventilation is associated with mortality in critically ill patients: an analysis of patients in two observational cohorts. Intensive Care Med. 2018;44(11):1914-1922. doi:10.1007/s00134-018-5375-6
  6. 6. Cressoni M, Chiumello D, Chiurazzi C, et al. Lung inhomogeneities, inflation and [18F]2-fluoro-2-deoxy-D-glucose uptake rate in acute respiratory distress syndrome. Eur Respir J. 2016;47(1):233-242. doi:10.1183/13993003.00885-2015
  7. 7. Gattinoni L, Caironi P, Cressoni M, et al. Lung recruitment in patients with the acute respiratory distress syndrome. N Engl J Med. 2006;354(17):1775-1786. doi:10.1056/NEJMoa052052
  8. 8. Cressoni M, Chiumello D, Algieri I, et al. Opening pressures and atelectrauma in acute respiratory distress syndrome. Intensive Care Med. 2017;43(5):603-611. doi:10.1007/s00134-017-4754-8
  9. 9. Chiumello D, Cressoni M, Carlesso E, et al. Bedside selection of positive end-expiratory pressure in mild, moderate, and severe acute respiratory distress syndrome. Crit Care Med. 2014;42(2):252-264. doi:10.1097/CCM.0b013e3182a6384f
  10. 10. Chiumello D, Marino A, Brioni M, et al. Lung Recruitment Assessed by Respiratory Mechanics and Computed Tomography in Patients with Acute Respiratory Distress Syndrome. What Is the Relationship?. Am J Respir Crit Care Med. 2016;193(11):1254-1263. doi:10.1164/rccm.201507-1413OC
  11. 11. Chiumello D, Mongodi S, Algieri I, et al. Assessment of Lung Aeration and Recruitment by CT Scan and Ultrasound in Acute Respiratory Distress Syndrome Patients. Crit Care Med. 2018;46(11):1761-1768. doi:10.1097/CCM.0000000000003340
  12. 12. Chiumello D, Marino A, Cressoni M, et al. Pleural effusion in patients with acute lung injury: a CT scan study. Crit Care Med. 2013;41(4):935-944. doi:10.1097/CCM.0b013e318275892c
  13. 13. Becher T, van der Staay M, Schädler D, Frerichs I, Weiler N. Calculation of mechanical power for pressure-controlled ventilation. Intensive Care Med. 2019;45(9):1321-1323. doi:10.1007/s00134-019-05636-8
  14. 14. Chiumello D, Gotti M, Guanziroli M, et al. Bedside calculation of mechanical power during volume- and pressure-controlled mechanical ventilation. Crit Care. 2020;24(1):417. Published 2020 Jul 11. doi:10.1186/s13054-020-03116-w

Mechanical power at a glance: a simple surrogate for volume-controlled ventilation.

Giosa L, Busana M, Pasticci I, et al. Mechanical power at a glance: a simple surrogate for volume-controlled ventilation. Intensive Care Med Exp. 2019;7(1):61. Published 2019 Nov 27. doi:10.1186/s40635-019-0276-8


BACKGROUND

Mechanical power is a summary variable including all the components which can possibly cause VILI (pressures, volume, flow, respiratory rate). Since the complexity of its mathematical computation is one of the major factors that delay its clinical use, we propose here a simple and easy to remember equation to estimate mechanical power under volume-controlled ventilation: [Formula: see text] where the mechanical power is expressed in Joules/minute, the minute ventilation (VE) in liters/minute, the inspiratory flow (F) in liters/minute, and peak pressure and positive end-expiratory pressure (PEEP) in centimeter of water. All the components of this equation are continuously displayed by any ventilator under volume-controlled ventilation without the need for clinician intervention. To test the accuracy of this new equation, we compared it with the reference formula of mechanical power that we proposed for volume-controlled ventilation in the past. The comparisons were made in a cohort of mechanically ventilated pigs (485 observations) and in a cohort of ICU patients (265 observations).

RESULTS

Both in pigs and in ICU patients, the correlation between our equation and the reference one was close to the identity. Indeed, the R2 ranged from 0.97 to 0.99 and the Bland-Altman showed small biases (ranging from + 0.35 to - 0.53 J/min) and proportional errors (ranging from + 0.02 to - 0.05).

CONCLUSIONS

Our new equation of mechanical power for volume-controlled ventilation represents a simple and accurate alternative to the more complex ones available to date. This equation does not need any clinical intervention on the ventilator (such as an inspiratory hold) and could be easily implemented in the software of any ventilator in volume-controlled mode. This would allow the clinician to have an estimation of mechanical power at a simple glance and thus increase the clinical consciousness of this variable which is still far from being used at the bedside. Our equation carries the same limitations of all other formulas of mechanical power, the most important of which, as far as it concerns VILI prevention, are the lack of normalization and its application to the whole respiratory system (including the chest wall) and not only to the lung parenchyma.

Driving pressure and survival in the acute respiratory distress syndrome.

Amato MB, Meade MO, Slutsky AS, et al. Driving pressure and survival in the acute respiratory distress syndrome. N Engl J Med. 2015;372(8):747-755. doi:10.1056/NEJMsa1410639


BACKGROUND

Mechanical-ventilation strategies that use lower end-inspiratory (plateau) airway pressures, lower tidal volumes (VT), and higher positive end-expiratory pressures (PEEPs) can improve survival in patients with the acute respiratory distress syndrome (ARDS), but the relative importance of each of these components is uncertain. Because respiratory-system compliance (CRS) is strongly related to the volume of aerated remaining functional lung during disease (termed functional lung size), we hypothesized that driving pressure (ΔP=VT/CRS), in which VT is intrinsically normalized to functional lung size (instead of predicted lung size in healthy persons), would be an index more strongly associated with survival than VT or PEEP in patients who are not actively breathing.

METHODS

Using a statistical tool known as multilevel mediation analysis to analyze individual data from 3562 patients with ARDS enrolled in nine previously reported randomized trials, we examined ΔP as an independent variable associated with survival. In the mediation analysis, we estimated the isolated effects of changes in ΔP resulting from randomized ventilator settings while minimizing confounding due to the baseline severity of lung disease.

RESULTS

Among ventilation variables, ΔP was most strongly associated with survival. A 1-SD increment in ΔP (approximately 7 cm of water) was associated with increased mortality (relative risk, 1.41; 95% confidence interval [CI], 1.31 to 1.51; P<0.001), even in patients receiving "protective" plateau pressures and VT (relative risk, 1.36; 95% CI, 1.17 to 1.58; P<0.001). Individual changes in VT or PEEP after randomization were not independently associated with survival; they were associated only if they were among the changes that led to reductions in ΔP (mediation effects of ΔP, P=0.004 and P=0.001, respectively).

CONCLUSIONS

We found that ΔP was the ventilation variable that best stratified risk. Decreases in ΔP owing to changes in ventilator settings were strongly associated with increased survival. (Funded by Fundação de Amparo e Pesquisa do Estado de São Paulo and others.).

Effects of decreased respiratory frequency on ventilator-induced lung injury.

Hotchkiss JR Jr, Blanch L, Murias G, et al. Effects of decreased respiratory frequency on ventilator-induced lung injury. Am J Respir Crit Care Med. 2000;161(2 Pt 1):463-468. doi:10.1164/ajrccm.161.2.9811008

To determine if decreased respiratory frequency (ventilatory rate) improves indices of lung damage, 17 sets of isolated, perfused rabbit lungs were ventilated with a peak static airway pressure of 30 cm H(2)O. All lungs were randomized to one of three frequency/peak pulmonary artery pressure combinations: F20P35 (n = 6): ventilatory frequency, 20 breaths/min, and peak pulmonary artery pressure, 35 mm Hg; F3P35 (n = 6), ventilatory frequency, 3 breaths/min, and peak pulmonary artery pressure of 35 mm Hg; or F20P20 (n = 5), ventilatory frequency, 20 breaths/min, and peak pulmonary artery pressure, 20 mm Hg. Mean airway pressure and tidal volume were matched between groups. Mean pulmonary artery pressure and vascular flow were matched between groups F20P35 and F3P35. The F20P35 group showed at least a 4.5-fold greater mean weight gain and a 3-fold greater mean incidence of perivascular hemorrhage than did the comparison groups, all p

Driving pressure and mechanical power: new targets for VILI prevention.

Tonetti T, Vasques F, Rapetti F, et al. Driving pressure and mechanical power: new targets for VILI prevention. Ann Transl Med. 2017;5(14):286. doi:10.21037/atm.2017.07.08

Several factors have been recognized as possible triggers of ventilator-induced lung injury (VILI). The first is pressure (thus the 'barotrauma'), then the volume (hence the 'volutrauma'), finally the cyclic opening-closing of the lung units ('atelectrauma'). Less attention has been paid to the respiratory rate and the flow, although both theoretical considerations and experimental evidence attribute them a significant role in the generation of VILI. The initial injury to the lung parenchyma is necessarily mechanical and it could manifest as an unphysiological distortion of the extracellular matrix and/or as micro-fractures in the hyaluronan, likely the most fragile polymer embedded in the matrix. The order of magnitude of the energy required to break a molecular bond between the hyaluronan and the associated protein is 1.12×10⁻¹⁶ Joules (J), 70-90% higher than the average energy delivered by a single breath of 1L assuming a lung elastance of 10 cmH2O/L (0.5 J). With a normal statistical distribution of the bond strength some polymers will be exposed each cycle to an energy large enough to rupture. Both the extracellular matrix distortion and the polymer fractures lead to inflammatory increase of capillary permeability with edema if a pulmonary blood flow is sufficient. The mediation analysis of higher vs. lower tidal volume and PEEP studies suggests that the driving pressure, more than tidal volume, is the best predictor of VILI, as inferred by increased mortality. This is not surprising, as both tidal volume and respiratory system elastance (resulting in driving pressure) may independently contribute to the mortality. For the same elastance driving pressure is a predictor similar to plateau pressure or tidal volume. Driving pressure is one of the components of the mechanical power, which also includes respiratory rate, flow and PEEP. Finding the threshold for mechanical power would greatly simplify assessment and prevention of VILI.

Mechanical power of ventilation is associated with mortality in critically ill patients: an analysis of patients in two observational cohorts.

Serpa Neto A, Deliberato RO, Johnson AEW, et al. Mechanical power of ventilation is associated with mortality in critically ill patients: an analysis of patients in two observational cohorts. Intensive Care Med. 2018;44(11):1914-1922. doi:10.1007/s00134-018-5375-6


PURPOSE

Mechanical power (MP) may unify variables known to be related to development of ventilator-induced lung injury. The aim of this study is to examine the association between MP and mortality in critically ill patients receiving invasive ventilation for at least 48 h.

METHODS

This is an analysis of data stored in the databases of the MIMIC-III and eICU. Critically ill patients receiving invasive ventilation for at least 48 h were included. The exposure of interest was MP. The primary outcome was in-hospital mortality.

RESULTS

Data from 8207 patients were analyzed. Median MP during the second 24 h was 21.4 (16.2-28.1) J/min in MIMIC-III and 16.0 (11.7-22.1) J/min in eICU. MP was independently associated with in-hospital mortality [odds ratio per 5 J/min increase (OR) 1.06 (95% confidence interval (CI) 1.01-1.11); p = 0.021 in MIMIC-III, and 1.10 (1.02-1.18); p = 0.010 in eICU]. MP was also associated with ICU mortality, 30-day mortality, and with ventilator-free days, ICU and hospital length of stay. Even at low tidal volume, high MP was associated with in-hospital mortality [OR 1.70 (1.32-2.18); p < 0.001] and other secondary outcomes. Finally, there is a consistent increase in the risk of death with MP higher than 17.0 J/min.

CONCLUSION

High MP of ventilation is independently associated with higher in-hospital mortality and several other outcomes in ICU patients receiving invasive ventilation for at least 48 h.

Lung inhomogeneities, inflation and [18F]2-fluoro-2-deoxy-D-glucose uptake rate in acute respiratory distress syndrome.

Cressoni M, Chiumello D, Chiurazzi C, et al. Lung inhomogeneities, inflation and [18F]2-fluoro-2-deoxy-D-glucose uptake rate in acute respiratory distress syndrome. Eur Respir J. 2016;47(1):233-242. doi:10.1183/13993003.00885-2015

The aim of the study was to determine the size and location of homogeneous inflamed/noninflamed and inhomogeneous inflamed/noninflamed lung compartments and their association with acute respiratory distress syndrome (ARDS) severity.In total, 20 ARDS patients underwent 5 and 45 cmH2O computed tomography (CT) scans to measure lung recruitability. [(18)F]2-fluoro-2-deoxy-d-glucose ([(18)F]FDG) uptake and lung inhomogeneities were quantified with a positron emission tomography-CT scan at 10 cmH2O. We defined four compartments with normal/abnormal [(18)F]FDG uptake and lung homogeneity.The homogeneous compartment with normal [(18)F]FDG uptake was primarily composed of well-inflated tissue (80±16%), double-sized in nondependent lung (32±27% versus 16±17%, p<0.0001) and decreased in size from mild, moderate to severe ARDS (33±14%, 26±20% and 5±9% of the total lung volume, respectively, p=0.05). The homogeneous compartment with high [(18)F]FDG uptake was similarly distributed between the dependent and nondependent lung. The inhomogeneous compartment with normal [(18)F]FDG uptake represented 4% of the lung volume. The inhomogeneous compartment with high [(18)F]FDG uptake was preferentially located in the dependent lung (21±10% versus 12±10%, p<0.0001), mostly at the open/closed interfaces and related to recruitability (r(2)=0.53, p<0.001).The homogeneous lung compartment with normal inflation and [(18)F]FDG uptake decreases with ARDS severity, while the inhomogeneous poorly/not inflated compartment increases. Most of the lung inhomogeneities are inflamed. A minor fraction of healthy tissue remains in severe ARDS.

Lung recruitment in patients with the acute respiratory distress syndrome.

Gattinoni L, Caironi P, Cressoni M, et al. Lung recruitment in patients with the acute respiratory distress syndrome. N Engl J Med. 2006;354(17):1775-1786. doi:10.1056/NEJMoa052052


BACKGROUND

In the acute respiratory distress syndrome (ARDS), positive end-expiratory pressure (PEEP) may decrease ventilator-induced lung injury by keeping lung regions open that otherwise would be collapsed. Since the effects of PEEP probably depend on the recruitability of lung tissue, we conducted a study to examine the relationship between the percentage of potentially recruitable lung, as indicated by computed tomography (CT), and the clinical and physiological effects of PEEP.

METHODS

Sixty-eight patients with acute lung injury or ARDS underwent whole-lung CT during breath-holding sessions at airway pressures of 5, 15, and 45 cm of water. The percentage of potentially recruitable lung was defined as the proportion of lung tissue in which aeration was restored at airway pressures between 5 and 45 cm of water.

RESULTS

The percentage of potentially recruitable lung varied widely in the population, accounting for a mean (+/-SD) of 13+/-11 percent of the lung weight, and was highly correlated with the percentage of lung tissue in which aeration was maintained after the application of PEEP (r2=0.72, P<0.001). On average, 24 percent of the lung could not be recruited. Patients with a higher percentage of potentially recruitable lung (greater than the median value of 9 percent) had greater total lung weights (P<0.001), poorer oxygenation (defined as a ratio of partial pressure of arterial oxygen to fraction of inspired oxygen) (P<0.001) and respiratory-system compliance (P=0.002), higher levels of dead space (P=0.002), and higher rates of death (P=0.02) than patients with a lower percentage of potentially recruitable lung. The combined physiological variables predicted, with a sensitivity of 71 percent and a specificity of 59 percent, whether a patient's proportion of potentially recruitable lung was higher or lower than the median.

CONCLUSIONS

In ARDS, the percentage of potentially recruitable lung is extremely variable and is strongly associated with the response to PEEP.

Opening pressures and atelectrauma in acute respiratory distress syndrome.

Cressoni M, Chiumello D, Algieri I, et al. Opening pressures and atelectrauma in acute respiratory distress syndrome. Intensive Care Med. 2017;43(5):603-611. doi:10.1007/s00134-017-4754-8


PURPOSE

Open lung strategy during ARDS aims to decrease the ventilator-induced lung injury by minimizing the atelectrauma and stress/strain maldistribution. We aim to assess how much of the lung is opened and kept open within the limits of mechanical ventilation considered safe (i.e., plateau pressure 30 cmH2O, PEEP 15 cmH2O).

METHODS

Prospective study from two university hospitals. Thirty-three ARDS patients (5 mild, 10 moderate, 9 severe without extracorporeal support, ECMO, and 9 severe with it) underwent two low-dose end-expiratory CT scans at PEEP 5 and 15 cmH2O and four end-inspiratory CT scans (from 19 to 40 cmH2O). Recruitment was defined as the fraction of lung tissue which regained inflation. The atelectrauma was estimated as the difference between the intratidal tissue collapse at 5 and 15 cmH2O PEEP. Lung ventilation inhomogeneities were estimated as the ratio of inflation between neighboring lung units.

RESULTS

The lung tissue which is opened between 30 and 45 cmH2O (i.e., always closed at plateau 30 cmH2O) was 10 ± 29, 54 ± 86, 162 ± 92, and 185 ± 134 g in mild, moderate, and severe ARDS without and with ECMO, respectively (p < 0.05 mild versus severe without or with ECMO). The intratidal collapses were similar at PEEP 5 and 15 cmH2O (63 ± 26 vs 39 ± 32 g in mild ARDS, p = 0.23; 92 ± 53 vs 78 ± 142 g in moderate ARDS, p = 0.76; 110 ± 91 vs 89 ± 93, p = 0.57 in severe ARDS without ECMO; 135 ± 100 vs 104 ± 80, p = 0.32 in severe ARDS with ECMO). Increasing the applied airway pressure up to 45 cmH2O decreased the lung inhomogeneity slightly (but significantly) in mild and moderate ARDS, but not in severe ARDS.

CONCLUSIONS

Data show that the prerequisites of the open lung strategy are not satisfied using PEEP up to 15 cmH2O and plateau pressure up to 30 cmH2O. For an effective open lung strategy, higher pressures are required. Therefore, risks of atelectrauma must be weighted versus risks of volutrauma.

TRIAL REGISTRATION

Clinicaltrials.gov identifier: NCT01670747 ( www.clinicaltrials.gov ).

Bedside selection of positive end-expiratory pressure in mild, moderate, and severe acute respiratory distress syndrome.

Chiumello D, Cressoni M, Carlesso E, et al. Bedside selection of positive end-expiratory pressure in mild, moderate, and severe acute respiratory distress syndrome. Crit Care Med. 2014;42(2):252-264. doi:10.1097/CCM.0b013e3182a6384f


OBJECTIVE

Positive end-expiratory pressure exerts its effects keeping open at end-expiration previously collapsed areas of the lung; consequently, higher positive end-expiratory pressure should be limited to patients with high recruitability. We aimed to determine which bedside method would provide positive end-expiratory pressure better related to lung recruitability.

DESIGN

Prospective study performed between 2008 and 2011.

SETTING

Two university hospitals (Italy and Germany).

PATIENTS

Fifty-one patients with acute respiratory distress syndrome.

INTERVENTIONS

Whole lung CT scans were taken in static conditions at 5 and 45 cm H2O during an end-expiratory/end-inspiratory pause to measure lung recruitability. To select individual positive end-expiratory pressure, we applied bedside methods based on lung mechanics (ExPress, stress index), esophageal pressure, and oxygenation (higher positive end-expiratory pressure table of lung open ventilation study).

MEASUREMENTS AND MAIN RESULTS

Patients were classified in mild, moderate and severe acute respiratory distress syndrome. Positive end-expiratory pressure levels selected by the ExPress, stress index, and absolute esophageal pressures methods were unrelated with lung recruitability, whereas positive end-expiratory pressure levels selected by the lung open ventilation method showed a weak relationship with lung recruitability (r = 0.29; p < 0.0001). When patients were classified according to the acute respiratory distress syndrome Berlin definition, the lung open ventilation method was the only one which gave lower positive end-expiratory pressure levels in mild and moderate acute respiratory distress syndrome compared with severe acute respiratory distress syndrome (8 ± 2 and 11 ± 3 cm H2O vs 15 ± 3 cm H2O; p < 0.05), whereas ExPress, stress index, and esophageal pressure methods gave similar positive end-expiratory pressure values in mild, moderate, and severe acute respiratory distress syndrome. The positive end-expiratory pressure selected by the different methods were unrelated to each other with the exception of the two methods based on lung mechanics (ExPress and stress index).

CONCLUSIONS

Bedside positive end-expiratory pressure selection methods based on lung mechanics or absolute esophageal pressures provide positive end-expiratory pressure levels unrelated to lung recruitability and similar in mild, moderate, and severe acute respiratory distress syndrome, whereas the oxygenation-based method provided positive end-expiratory pressure levels related with lung recruitability progressively increasing from mild to moderate and severe acute respiratory distress syndrome.

Lung Recruitment Assessed by Respiratory Mechanics and Computed Tomography in Patients with Acute Respiratory Distress Syndrome. What Is the Relationship?

Chiumello D, Marino A, Brioni M, et al. Lung Recruitment Assessed by Respiratory Mechanics and Computed Tomography in Patients with Acute Respiratory Distress Syndrome. What Is the Relationship?. Am J Respir Crit Care Med. 2016;193(11):1254-1263. doi:10.1164/rccm.201507-1413OC


RATIONALE

The assessment of lung recruitability in patients with acute respiratory distress syndrome (ARDS) may be important for planning recruitment maneuvers and setting positive end-expiratory pressure (PEEP).

OBJECTIVES

To determine whether lung recruitment measured by respiratory mechanics is comparable with lung recruitment measured by computed tomography (CT).

METHODS

In 22 patients with ARDS, lung recruitment was assessed at 5 and 15 cm H2O PEEP by using respiratory mechanics-based methods: (1) increase in gas volume between two pressure-volume curves (P-Vrs curve); (2) increase in gas volume measured and predicted on the basis of expected end-expiratory lung volume and static compliance of the respiratory system (EELV-Cst,rs); as well as by CT scan: (3) decrease in noninflated lung tissue (CT [not inflated]); and (4) decrease in noninflated and poorly inflated tissue (CT [not + poorly inflated]).

MEASUREMENTS AND MAIN RESULTS

The P-Vrs curve recruitment was significantly higher than EELV-Cst,rs recruitment (423 ± 223 ml vs. 315 ± 201 ml; P < 0.001), but these measures were significantly related to each other (R(2) = 0.93; P < 0.001). CT (not inflated) recruitment was 77 ± 86 g and CT (not + poorly inflated) was 80 ± 67 g (P = 0.856), and these measures were also significantly related to each other (R(2) = 0.20; P = 0.04). Recruitment measured by respiratory mechanics was 54 ± 28% (P-Vrs curve) and 39 ± 25% (EELV-Cst,rs) of the gas volume at 5 cm H2O PEEP. Recruitment measured by CT scan was 5 ± 5% (CT [not inflated]) and 6 ± 6% (CT [not + poorly inflated]) of lung tissue.

CONCLUSIONS

Respiratory mechanics and CT measure-under the same term, "recruitment"-two different entities. The respiratory mechanics-based methods include gas entering in already open pulmonary units that improve their mechanical properties at higher PEEP. Consequently, they can be used to assess the overall improvement of inflation. The CT scan measures the amount of collapsed tissue that regains inflation. Clinical trial registered with www.clinicaltrials.gov (NCT00759590).

Assessment of Lung Aeration and Recruitment by CT Scan and Ultrasound in Acute Respiratory Distress Syndrome Patients.

Chiumello D, Mongodi S, Algieri I, et al. Assessment of Lung Aeration and Recruitment by CT Scan and Ultrasound in Acute Respiratory Distress Syndrome Patients. Crit Care Med. 2018;46(11):1761-1768. doi:10.1097/CCM.0000000000003340


OBJECTIVES

Lung ultrasound is commonly used to evaluate lung morphology in patients with acute respiratory distress syndrome. Aim of this study was to determine lung ultrasound reliability in assessing lung aeration and positive end-expiratory pressure-induced recruitment compared with CT.

DESIGN

Randomized crossover study.

SETTING

University hospital ICU.

PATIENTS

Twenty sedated paralyzed acute respiratory distress syndrome patients: age 56 years (43-72 yr), body mass index 25 kg/m (22-27 kg/m), and PaO2/FIO2 160 (113-218).

INTERVENTIONS

Lung CT and lung ultrasound examination were performed at positive end-expiratory pressure 5 and 15 cm H2O.

MEASUREMENTS AND MAIN RESULTS

Global and regional Lung Ultrasound scores were compared with CT quantitative analysis. Lung recruitment (i.e., decrease in not aerated tissue as assessed with CT) was compared with global Lung Ultrasound score variations. Global Lung Ultrasound score was strongly associated with average lung tissue density at positive end-expiratory pressure 5 (R = 0.78; p < 0.0001) and positive end-expiratory pressure 15 (R = 0.62; p < 0.0001). Regional Lung Ultrasound score strongly correlated with tissue density at positive end-expiratory pressure 5 (rs = 0.79; p < 0.0001) and positive end-expiratory pressure 15 (rs = 0.79; p < 0.0001). Each step increase of regional Lung Ultrasound score was associated with significant increase of tissue density (p < 0.005). A substantial agreement was found between regional Lung Ultrasound score and CT classification at positive end-expiratory pressure 5 (k = 0.69 [0.63-0.75]) and at positive end-expiratory pressure 15 (k = 0.70 [0.64-0.75]). At positive end-expiratory pressure 15, both global Lung Ultrasound score (22 [16-27] vs 26 [21-29]; p < 0.0001) and not aerated tissue (42% [25-57%] vs 52% [39-67%]; p < 0.0001) decreased. However, Lung Ultrasound score variations were not associated with lung recruitment (R = 0.01; p = 0.67).

CONCLUSIONS

Lung Ultrasound score is a valid tool to assess regional and global lung aeration. Global Lung Ultrasound score variations should not be used for bedside assessment of positive end-expiratory pressure-induced recruitment.

Pleural effusion in patients with acute lung injury: a CT scan study.

Chiumello D, Marino A, Cressoni M, et al. Pleural effusion in patients with acute lung injury: a CT scan study. Crit Care Med. 2013;41(4):935-944. doi:10.1097/CCM.0b013e318275892c


OBJECTIVES

Pleural effusion is a frequent finding in patients with acute respiratory distress syndrome. To assess the effects of pleural effusion in patients with acute lung injury on lung volume, respiratory mechanics, gas exchange, lung recruitability, and response to positive end-expiratory pressure.

DESIGN, SETTING, AND PATIENTS

A total of 129 acute lung injury or acute respiratory distress syndrome patients, 68 analyzed retrospectively and 61 prospectively, studied at two University Hospitals.

INTERVENTIONS

Whole-lung CT was performed during two breath-holding pressures (5 and 45 cm H2O). Two levels of positive end-expiratory pressure (5 and 15 cm H2O) were randomly applied.

MEASUREMENTS

Pleural effusion volume was determined on each CT scan section; respiratory system mechanics, gas exchange, and hemodynamics were measured at 5 and 15 cm H2O positive end-expiratory pressure. In 60 patients, elastances of lung and chest wall were computed, and lung and chest wall displacements were estimated.

RESULTS

Patients were divided into higher and lower pleural effusion groups according to the median value (287 mL). Patients with higher pleural effusion were older (62±16 yr vs. 54±17 yr, p<0.01) with a lower minute ventilation (8.8±2.2 L/min vs. 10.1±2.9 L/min, p<0.01) and respiratory rate (16±5 bpm vs. 19±6 bpm, p<0.01) than those with lower pleural effusion. Both at 5 and 15 cm H2O of positive end-expiratory pressure PaO2/FIO2, respiratory system elastance, lung weight, normally aerated tissue, collapsed tissue, and lung and chest wall elastances were similar between the two groups. The thoracic cage expansion (405±172 mL vs. 80±87 mL, p<0.0001, for higher pleural effusion group vs. lower pleural effusion group) was greater than the estimated lung compression (178±124 mL vs. 23±29 mL, p<0.0001 for higher pleural effusion group vs. lower pleural effusion group, respectively).

CONCLUSIONS

Pleural effusion in acute lung injury or acute respiratory distress syndrome patients is of modest entity and leads to a greater chest wall expansion than lung reduction, without affecting gas exchange or respiratory mechanics.

Calculation of mechanical power for pressure-controlled ventilation.

Becher T, van der Staay M, Schädler D, Frerichs I, Weiler N. Calculation of mechanical power for pressure-controlled ventilation. Intensive Care Med. 2019;45(9):1321-1323. doi:10.1007/s00134-019-05636-8

Bedside calculation of mechanical power during volume- and pressure-controlled mechanical ventilation.

Chiumello D, Gotti M, Guanziroli M, et al. Bedside calculation of mechanical power during volume- and pressure-controlled mechanical ventilation. Crit Care. 2020;24(1):417. Published 2020 Jul 11. doi:10.1186/s13054-020-03116-w


BACKGROUND

Mechanical power (MP) is the energy delivered to the respiratory system over time during mechanical ventilation. Our aim was to compare the currently available methods to calculate MP during volume- and pressure-controlled ventilation, comparing different equations with the geometric reference method, to understand whether the easier to use surrogate formulas were suitable for the everyday clinical practice. This would warrant a more widespread use of mechanical power to promote lung protection.

METHODS

Forty respiratory failure patients, sedated and paralyzed for clinical reasons, were ventilated in volume-controlled ventilation, at two inspiratory flows (30 and 60 L/min), and pressure-controlled ventilation with a similar tidal volume. Mechanical power was computed both with the geometric method, as the area between the inspiratory limb of the airway pressure and the volume, and with two algebraic methods, a comprehensive and a surrogate formula.

RESULTS

The bias between the MP computed by the geometric method and by the comprehensive algebraic method during volume-controlled ventilation was respectively 0.053 (0.77, - 0.81) J/min and - 0.4 (0.70, - 1.50) J/min at low and high flows (r2 = 0.96 and 0.97, p < 0.01). The MP measured and computed by the two methods were highly correlated (r2 = 0.95 and 0.94, p < 0.01) with a bias of - 0.0074 (0.91, - 0.93) and - 1.0 (0.45, - 2.52) J/min at high-low flows. During pressure-controlled ventilation, the bias between the MP measured and the one calculated with the comprehensive and simplified methods was correlated (r2 = 0.81, 0.94, p < 0.01) with mean differences of - 0.001 (2.05, - 2.05) and - 0.81 (2.11, - 0.48) J/min.

CONCLUSIONS

Both for volume-controlled and pressure-controlled ventilation, the surrogate formulas approximate the reference method well enough to warrant their use in the everyday clinical practice. Given that these formulas require nothing more than the variables already displayed by the intensive care ventilator, a more widespread use of mechanical power should be encouraged to promote lung protection against ventilator-induced lung injury.

Related articles. Get a deeper look