Back

プレッシャー/ボリューム曲線を使用したリクルータビリティの評価方法

Article

Author: Jean-Michel Arnal

Date of first publication: 09.04.2024

プレッシャー/ボリューム曲線の使用は、患者の肺リクルートメントの可能性を評価するための実証された方法です。

P/V Toolの設定

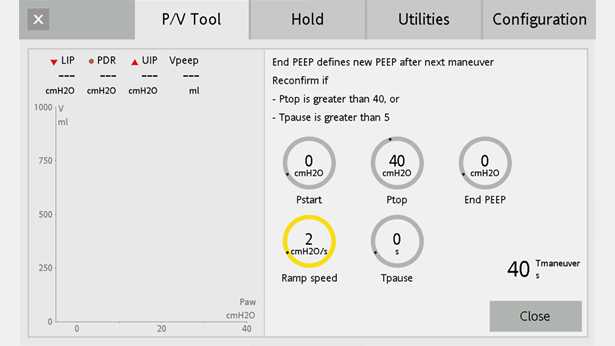
ベッドサイドでのリクルータビリティの評価は、自発呼吸がまったくない早発性ARDS患者において、人工呼吸器回路にリークがない状態で行うことができます。[P/V Tool](Available as an option on HAMILTON-G5 and HAMILTON-C3/C6 ventilatorsA​, Standard on the HAMILTON-S1B​)タブで次の設定を使用して手技を開始します(図1を参照)。

  • スタート圧 = 0 hPa
  • トップ圧 = 40 hPa
  • End PEEP = 0 hPa
  • 立上り速度 = 2 hPa/s
  • ホールド = 0 s

注:スタート圧とEnd PEEPに対して人工呼吸器のデフォルト設定(5 hPa)を使用して同じ評価を行うこともできます。 

Screenshot of PV Tool with initial settings
図1
Screenshot of PV Tool with initial settings
図1

解釈

P/V曲線と自動計算された各圧力のボリューム差を示すパネルを選択します(Paw/V + Paw/dVグラフ)(図2および図3)。

  • 吸気カーブと呼気カーブとの最大距離(これはdV曲線の最高点と一致します)を表す位置にカーソル1を配置します。
  • 手技中に達した最大ボリューム(圧力の最高点)を表す位置にカーソル2を配置します。 

これで正規化最大距離(NMD)を計算できます。NMDはパーセンテージで表され、最大距離÷最大ボリュームの式で計算します。

この例では、NMDは次のようになります。NMD = (674/1712) x 100 = 39%

NMD = 41%を境界として、リクルートメントの可能性が高い肺(NMD ≥ 41%)とリクルートメントの達成が難しい肺(NMD < 41%)を区別できます(
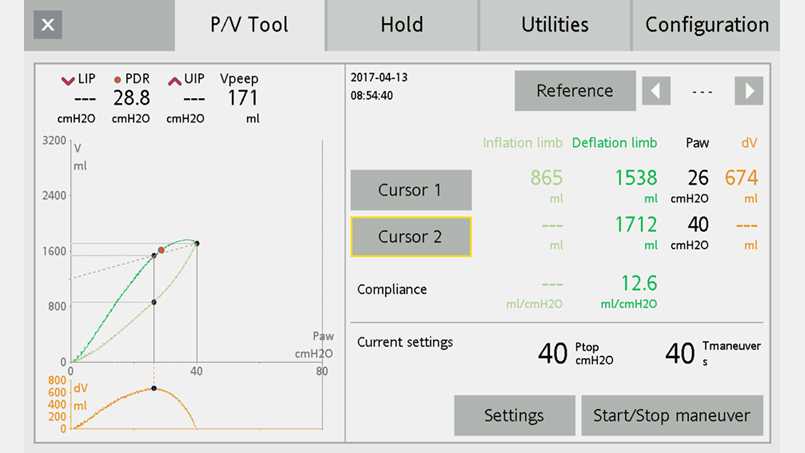
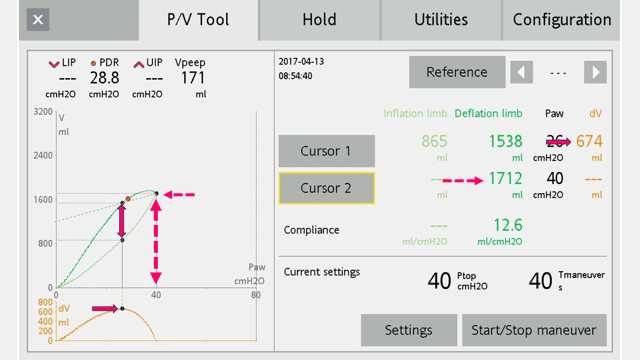
Chiumello D, Arnal JM, Umbrello M, et al. Hysteresis and Lung Recruitment in Acute Respiratory Distress Syndrome Patients: A CT Scan Study [published correction appears in Crit Care Med. 2022 Mar 1;50(3):e339]. Critical Care Medicine. 2020;48(10):1494-1502. doi:10.1097/CCM.00000000000045181)。

Paw/V + Paw/dVグラフを示すスクリーンショット
図2
Paw/V + Paw/dVグラフを示すスクリーンショット
図2
最大ボリュームとボリューム差を示すマーキングが付いたスクリーンショット
図3
最大ボリュームとボリューム差を示すマーキングが付いたスクリーンショット
図3

図4:
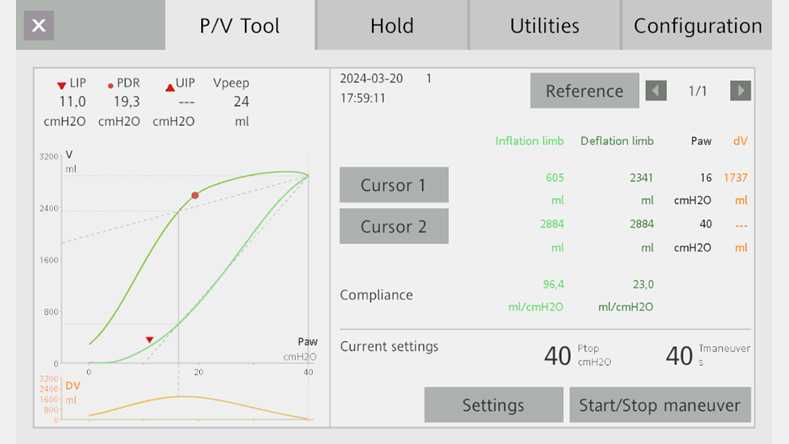
Aさんは72歳で、ARDSで入院しています。
NMD = (1737/2884) x 100 = 60%
この患者では、リクルートメント戦略が奏功する可能性は高いと考えられます。

図5:
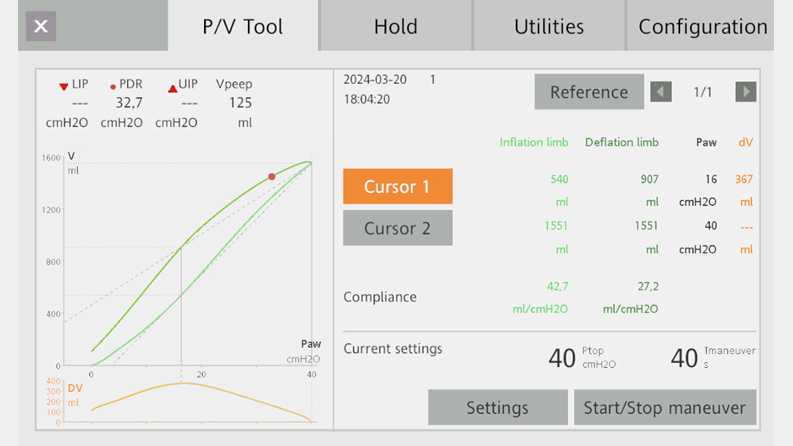
Lさんは66歳で、ARDSで入院しています。
NMD = (367/1551) x 100 = 24%
この患者では、リクルートメント戦略が奏功する可能性は低いと考えられます。

最大距離 = 1737、最大ボリューム = 2884のPVループを示すスクリーンショット
図4
最大距離 = 1737、最大ボリューム = 2884のPVループを示すスクリーンショット
図4
最大距離 = 367、最大ボリューム = 1551のPVループを示すスクリーンショット
図5
最大距離 = 367、最大ボリューム = 1551のPVループを示すスクリーンショット
図5

Hysteresis and Lung Recruitment in Acute Respiratory Distress Syndrome Patients: A CT Scan Study.

Chiumello D, Arnal JM, Umbrello M, et al. Hysteresis and Lung Recruitment in Acute Respiratory Distress Syndrome Patients: A CT Scan Study [published correction appears in Crit Care Med. 2022 Mar 1;50(3):e339]. Crit Care Med. 2020;48(10):1494-1502. doi:10.1097/CCM.0000000000004518

OBJECTIVES Hysteresis of the respiratory system pressure-volume curve is related to alveolar surface forces, lung stress relaxation, and tidal reexpansion/collapse. Hysteresis has been suggested as a means of assessing lung recruitment. The objective of this study was to determine the relationship between hysteresis, mechanical characteristics of the respiratory system, and lung recruitment assessed by a CT scan in mechanically ventilated acute respiratory distress syndrome patients. DESIGN Prospective observational study. SETTING General ICU of a university hospital. PATIENTS Twenty-five consecutive sedated and paralyzed patients with acute respiratory distress syndrome (age 64 ± 15 yr, body mass index 26 ± 6 kg/m, PaO2/FIO2 147 ± 42, and positive end-expiratory pressure 9.3 ± 1.4 cm H2O) were enrolled. INTERVENTIONS A low-flow inflation and deflation pressure-volume curve (5-45 cm H2O) and a sustained inflation recruitment maneuver (45 cm H2O for 30 s) were performed. A lung CT scan was performed during breath-holding pressure at 5 cm H2O and during the recruitment maneuver at 45 cm H2O. MEASUREMENTS AND MAIN RESULTS Lung recruitment was computed as the difference in noninflated tissue and in gas volume measured at 5 and at 45 cm H2O. Hysteresis was calculated as the ratio of the area enclosed by the pressure-volume curve and expressed as the hysteresis ratio. Hysteresis was correlated with respiratory system compliance computed at 5 cm H2O and the lung gas volume entering the lung during inflation of the pressure-volume curve (R = 0.749, p < 0.001 and R = 0.851, p < 0.001). The hysteresis ratio was related to both lung tissue and gas recruitment (R = 0.266, p = 0.008, R = 0.357, p = 0.002, respectively). Receiver operating characteristic analysis showed that the optimal cutoff value to predict lung tissue recruitment for the hysteresis ratio was 28% (area under the receiver operating characteristic curve, 0.80; 95% CI, 0.62-0.98), with sensitivity and specificity of 0.75 and 0.77, respectively. CONCLUSIONS Hysteresis of the respiratory system computed by low-flow pressure-volume curve is related to the anatomical lung characteristics and has an acceptable accuracy to predict lung recruitment.