
Whether the device is being used in the ICU, in the MRI suite, or during transport, the user interface on all our ventilators is operated in the same way.
Our Ventilation Cockpit integrates complex data into intuitive visualizations.
A study found that numerical and waveform displays alone are not enough to provide clinicians with an optimal level of support (
Our Ventilation Cockpit was inspired by aircraft cockpits where complex data is integrated and visualized in a simplified way.


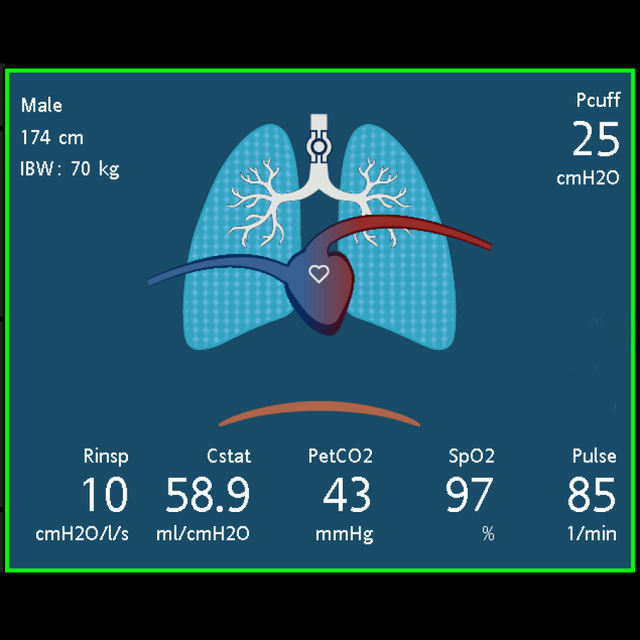
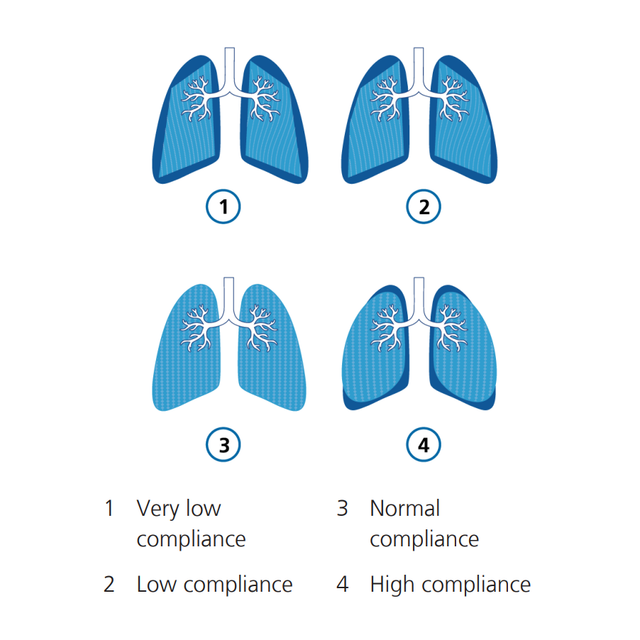
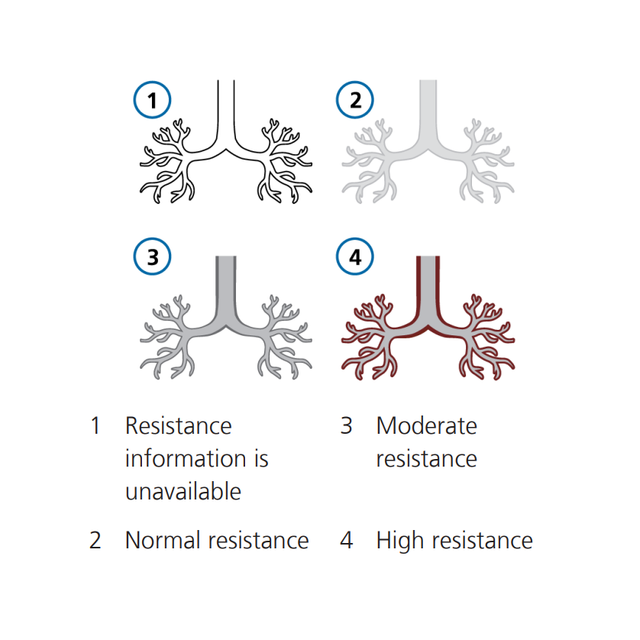
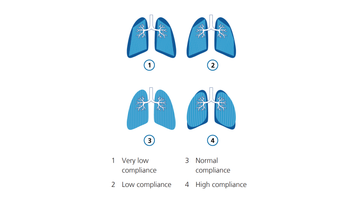
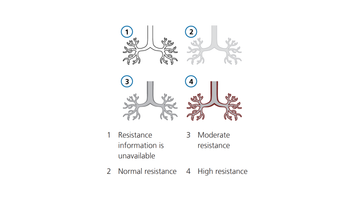
The Dynamic Lung panel visualizes the monitoring data below in real time. If all values are in a normal range, the panel is framed in green.
The lungs expand and contract in synchrony with actual breaths, based on the signal from the proximal flow sensor. The lung size shown is relative to the expected size based on the patient's height.
The animated diaphragm below the lungs shows the patient's spontaneous activity.
If the integrated cuff pressure controller, IntelliCuff, is connected and active (
The bronchial tree shows resistance on a breath by breath basis relative to the patient's height. The color of the bronchial tree shows the relative degree of resistance.
The numeric value is also displayed.
The shape of the lungs changes breath by breath with compliance (Cstat) relative to the patient’s height. The numeric value is also displayed.
If the SpO2 option (
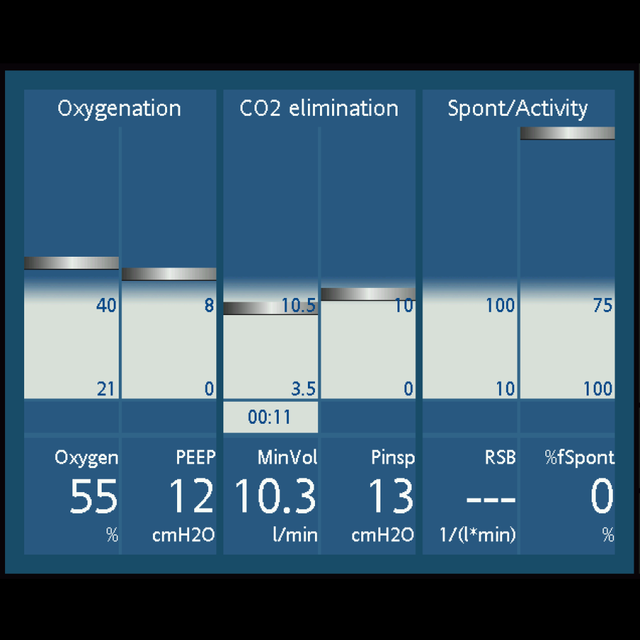
The Vent Status panel displays six parameters related to the patient’s ventilator dependence, including oxygenation, CO2 elimination, and patient activity.
A floating indicator within the column shows the value for a given parameter breath by breath. When the indicator enters the grey weaning zone, a timer starts, showing how long that value has been in the weaning zone.
When all values are in the weaning zone, the panel is framed in green, indicating that spontaneous breathing trials can be considered.

In my experience the Dynamic Lung is very helpful, because not everybody can always interpret the numbers, especially therapists who are just starting out. But they can understand the picture.
Clinical Education Coordinator
University Medical Center, Lubbock (TX), USA
The Ventilation Cockpit is a standard feature on all our critical care ventilators.